Bitcoin (BTC) continues to face significant resistance as it struggles to firmly establish a position above the crucial $72,000 level. Despite persistent selling pressure at this psychological and technical barrier, the bulls have demonstrated remarkable resilience, consistently stepping in to prevent deeper corrections. This ongoing tug-of-war highlights the pivotal nature of the $72,000 mark for Bitcoin’s near-term trajectory. Prominent trader Daan Crypto Trades, sharing insights on X, emphasized that for BTC to potentially "test the $80Ks again," it is imperative for the cryptocurrency to decisively cross and sustain above this $72,000 resistance area. A clear breakout and consolidation above this level would signal a renewed bullish momentum, potentially setting the stage for an assault on new all-time highs.
While traditional financial markets often react negatively to uncertainty, Bitcoin’s performance since the onset of the US and Israel-Iran conflict has showcased a surprising degree of stability. This resilience suggests that despite geopolitical tensions, a significant portion of the crypto community remains unwilling to capitulate and sell at lower price points. This sentiment is further supported by on-chain analytics. CryptoQuant analyst Darkfost observed in a post on X that March has predominantly recorded BTC outflows from crypto exchanges. This consistent withdrawal of Bitcoin from trading platforms, while not immediately sufficient to ignite a massive new uptrend, is a compelling indicator of genuine accumulation by long-term investors. Such outflows typically suggest that holders are moving their assets into cold storage, signaling a conviction in Bitcoin’s future appreciation rather than an intent to sell in the short term.
One of the underlying reasons for this sustained accumulation could be a widespread belief among investors that BTC is currently trading within a "value territory." Charles Edwards, founder of Capriole Investments, articulated this perspective on X, stating that Bitcoin is in "deep value" when assessed against the BTC Yardstick metric. This metric, which aims to identify periods of undervaluation, notably recorded numbers in February that dipped below even the lows seen during the 2022 bear market. Such a reading suggests that, from a historical valuation standpoint, Bitcoin is presenting a compelling opportunity for long-term investors, reinforcing the accumulation trend observed by Darkfost.

As Bitcoin navigates these critical resistance levels and investor sentiment continues to firm, a pertinent question arises: Could BTC and select major altcoins not only maintain but also break above their overhead resistance levels in the coming days or weeks? To gain a clearer understanding of the immediate future, let’s delve into a detailed technical analysis of the charts of the top 10 cryptocurrencies, examining key indicators and potential price movements.
Bitcoin Price Prediction
Bitcoin (BTC) continues its upward trajectory, trading within a well-defined bullish ascending triangle pattern. This pattern is a classic technical formation indicating that buyers are progressively gaining strength, pushing the price higher while encountering horizontal resistance at the top. In this instance, the bulls are vigorously attempting a comeback, consistently testing the overhead resistance.
The 20-day exponential moving average (EMA) currently sits at a relatively flat $70,303, while the Relative Strength Index (RSI) hovers near the midpoint. This configuration suggests a temporary equilibrium between buying and selling pressure, without a clear decisive advantage for either the bulls or the bears in the immediate short term. For the bullish momentum to fully materialize, buyers must decisively drive and maintain the BTC price above the critical $74,508 resistance level. A successful breach and sustained trading above this threshold would officially complete the ascending triangle pattern, a powerful signal for further upside. If this breakout occurs, the BTC/USDT pair could see a significant rally, with an initial target projected around $84,000, representing the measured move of the pattern.

However, this optimistic outlook will be invalidated in the near term if the price reverses its course, turns down sharply, and breaks below the ascending triangle’s support line. Such a breakdown would indicate that the bulls have exhausted their efforts and capitulated to selling pressure. In this bearish scenario, the BTC/USDT pair could experience a sharp decline, potentially plummeting toward the robust support zone ranging from $62,500 to $60,000. Traders should closely monitor these key levels for confirmation of the next directional move.
Ether Price Prediction
Ether (ETH), the native cryptocurrency of the Ethereum network, demonstrated encouraging signs on Monday by bouncing decisively off its 50-day simple moving average (SMA) at $2,042. This rebound is a positive indicator, suggesting that buyers are actively defending this key support level and that the overall sentiment remains optimistic for the second-largest cryptocurrency.
Similar to Bitcoin, the 20-day EMA for ETH is currently flattish at $2,121, and the RSI is positioned near the midpoint. This technical setup indicates a temporary balance between supply and demand, with neither buyers nor sellers holding a dominant position. To initiate a new upward trend, buyers will need to exert sufficient pressure to push the price above the $2,400 level. A successful breakout above this resistance would signal a renewed bullish impulse, potentially propelling the ETH/USDT pair toward $2,600, with an extended target reaching $3,050. These levels represent significant psychological and technical resistance points that, if overcome, could pave the way for a more substantial rally.

Conversely, if the ETH price turns down from its current position and decisively breaks below the 50-day SMA, it would signal a rejection of the recent attempts to break above the $2,111 level. Such a breakdown would indicate that bearish forces are gaining control, potentially pulling the pair down to the $1,900 support level. A further loss of this support could see the price decline toward the more substantial support at $1,750, a level that would require strong buying interest to prevent deeper corrections.
BNB Price Prediction
BNB, the native token of the Binance ecosystem, is currently witnessing a concerted effort by buyers to maintain its price above the 20-day EMA at $643. However, this endeavor is being met with strong resistance from the bears, indicating a fierce contest for market control.
With the 20-day EMA remaining flattish and the RSI positioned just below the midpoint, the technical indicators suggest that the BNB/USDT pair is likely to continue trading within a defined range of $570 to $687 for a few more days. This period of consolidation, characterized by sideways movement, is often a precursor to a more significant price action. The longer the price remains confined within such a range, the more powerful and decisive the eventual breakout from it tends to be.

Should buyers successfully drive the BNB price above the overhead resistance at $687, it would signal a bullish breakout from the consolidation phase. This move could see the pair surge toward $730, and potentially extend its rally to $790, as bullish momentum builds. Conversely, if the price turns down from its current level and breaks below $600, it would suggest that the bears have gained a slight advantage, indicating a potential weakening of bullish sentiment. In such a scenario, the BNB/USDT pair may slump toward the lower end of its established range, targeting $570.
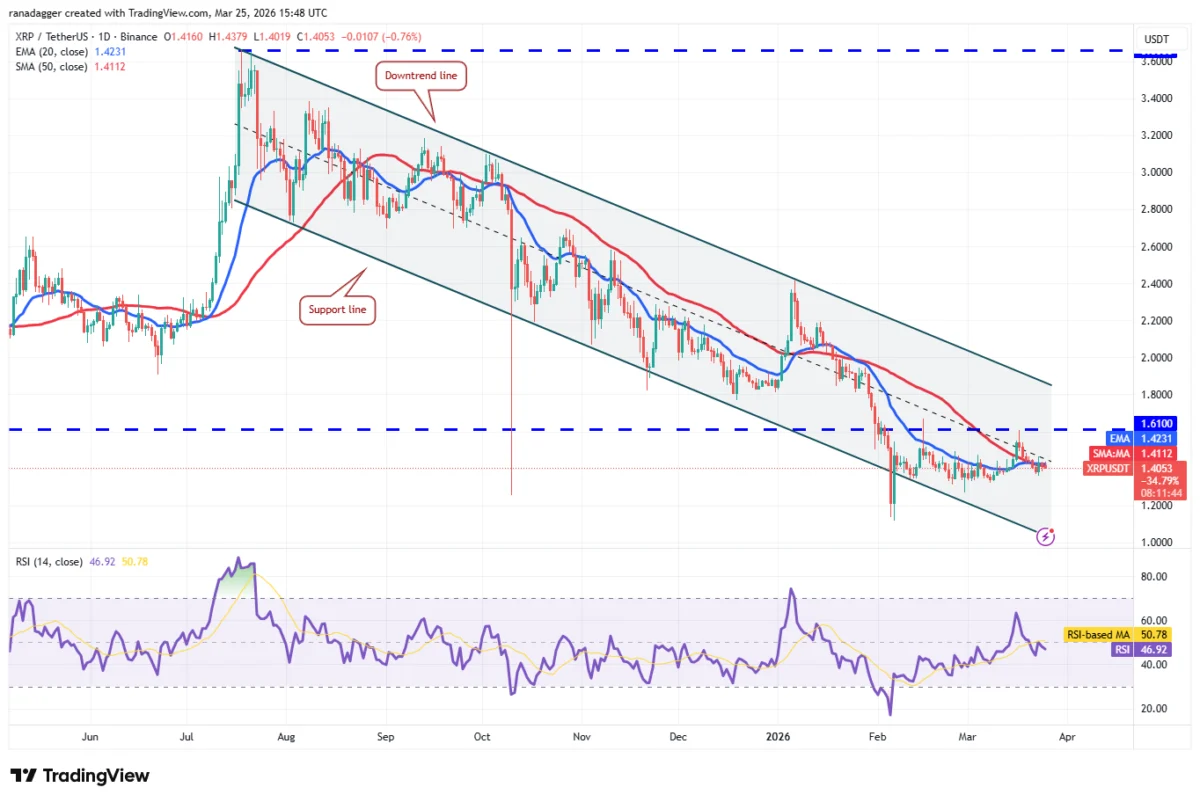
XRP Price Prediction
XRP, the cryptocurrency associated with Ripple Labs, is currently facing persistent selling pressure, with bears attempting to keep its price suppressed below the key moving averages. Despite this, the bulls are demonstrating resilience, consistently exerting buying pressure to prevent a significant downturn and hinting at a potential reversal.
If the XRP price manages to decisively break and sustain above both the 20-day EMA and the 50-day SMA, it would be a strong bullish signal. Such a move would indicate that buyers are gaining control, and the rally could extend toward the significant breakdown level of $1.61. Beyond this, the price would likely encounter the downtrend line, a critical resistance point. Sellers are expected to mount a fierce defense at this downtrend line, as a decisive close above it would signal a potential and significant change in the long-term trend for XRP.

On the other hand, if the price turns down from its current position and breaks below the $1.27 support level, it would confirm that the bears remain in control, continuing to suppress any upward movements. In this bearish scenario, the XRP/USDT pair may slump further toward the support line of the channel, a level where buyers are historically expected to step in and attempt to establish a bounce, potentially preventing deeper losses.
Solana Price Prediction
Solana (SOL) has been demonstrating a period of consolidation, trading within a relatively tight range defined by its 50-day SMA ($86) as support and the overhead resistance of $95 for the past few days. This sideways movement indicates a phase of indecision between buyers and sellers.
However, the gradually upsloping 20-day EMA ($89) and the RSI positioned just above the midpoint suggest a slight underlying advantage for the buyers. This subtle bullish bias indicates that buying pressure is slowly building. If bulls successfully manage to clear the overhead barrier at $95, it would be a decisive breakout, signaling a renewed bullish trend. In this scenario, the SOL/USDT pair could see a significant upward movement, potentially soaring toward $117.

Conversely, for sellers to regain control, they would need to actively pull the SOL price below the 50-day SMA. If they succeed in doing so, it would invalidate the recent bullish leanings and could lead to a decline toward the bottom of the established $76 to $95 range. A strong bounce off the $76 level would indicate that buyers are still present at lower prices, potentially extending the period of consolidation within this range for a longer duration, as neither side can secure a decisive victory.
Dogecoin Price Prediction
Dogecoin (DOGE), the popular meme coin, experienced a bounce off the $0.09 support level on Monday, indicating some buying interest at this price point. However, despite this rebound, the bulls are currently struggling to push the price decisively above the key moving averages, signaling persistent overhead resistance.
If the DOGE price turns down sharply from the moving averages, it would suggest that the bears are successfully defending these levels, increasing the probability of a breakdown below the crucial $0.09 support. Should this support fail, the DOGE/USDT pair could experience a significant tumble toward the next major support level at $0.06, a price point that has historically attracted strong buying interest.

Alternatively, a decisive close above both the 20-day EMA and the 50-day SMA would be a strong bullish signal, demonstrating solid buying accumulation at the $0.09 level. Such a breakout could propel the pair to $0.10, and potentially extend its rally to $0.12. The $0.12 level is expected to pose a substantial challenge for the bulls, as it represents a key resistance point where sellers are likely to step in aggressively.
Hyperliquid Price Prediction
Hyperliquid (HYPE) demonstrated a bullish reversal on Tuesday, rebounding strongly off the breakout level of $36.77. This action is a positive sign, indicating that the bulls are actively attempting to flip this previously resistive level into a strong support zone, confirming the validity of the earlier breakout.
The technical indicators for HYPE currently favor the bulls. The upsloping moving averages (both the 20-day EMA and 50-day SMA) and the RSI firmly entrenched in positive territory collectively suggest that buyers have a clear upper hand in the market. If buyers successfully drive the HYPE price above the $43.77 level, it would confirm the continuation of the uptrend, with the next significant price target likely set at $50. This represents a psychological and potential technical resistance level.

However, this positive outlook for HYPE would be invalidated in the near term if the price turns down sharply from its current position and breaks decisively below the $36.77 level. Such a breakdown would suggest that the market has rejected the previous breakout, indicating a false signal. In this bearish scenario, the HYPE/USDT pair may experience a significant tumble, potentially falling toward the 50-day SMA, currently positioned at $33.16, where buyers might attempt to re-establish support.
Cardano Price Prediction
Cardano (ADA) remains constrained within a descending channel pattern, a bearish formation characterized by lower highs and lower lows. Despite this overarching bearish structure, the bulls are showing signs of life, actively attempting to form a stable base near the $0.25 level, suggesting a potential accumulation phase.
A decisive close above both the 20-day EMA and the 50-day SMA would be a significant bullish development, opening the doors for a rally toward the upper boundary of the descending channel, specifically the downtrend line. Sellers are expected to aggressively defend this downtrend line, as a sustained close above it would signal a potential and meaningful change in the overall trend for ADA. If the bulls manage to breach this crucial resistance, the ADA/USDT pair could ascend to $0.39, and thereafter target $0.44, representing significant upside potential.

Conversely, if the ADA price turns down sharply from the downtrend line or fails to clear the moving averages, it would indicate that the bears remain dominant, actively selling on rallies. This scenario increases the likelihood of a decline below the critical $0.25 level. Should this support fail, the pair may plunge further toward the support line of the channel, where strong buying interest would be required to prevent deeper losses and maintain the integrity of the pattern.
Bitcoin Cash Price Prediction
Bitcoin Cash (BCH) closed above the 20-day EMA ($470) on Monday, a positive sign indicating some short-term buying strength. However, the bulls are currently struggling to extend this momentum and push the price decisively toward the 50-day SMA ($492), suggesting that overhead resistance is still strong.
This struggle to clear the 50-day SMA indicates that bears are active at higher price levels, stepping in to sell whenever the price attempts to rally. The sellers will likely attempt to capitalize on this weakness by pulling the BCH price back below the 20-day EMA. If they succeed, the BCH/USDT pair may drop toward the $443 level. This is a critical support level for the bulls to defend, as a decisive close below $443 would complete a bearish head-and-shoulders pattern, a strong reversal signal. If this pattern confirms, the next significant support on the downside is at $375, representing a substantial potential decline.

On the upside, if buyers can muster enough strength to thrust the price above the 50-day SMA, it would invalidate the bearish leanings and suggest the commencement of a stronger relief rally. Such a move could propel BCH toward the $520 level, indicating a shift in short-term momentum in favor of the bulls.
Chainlink Price Prediction
Chainlink (LINK) has been exhibiting a consistent and gradual upward movement, trading within a well-defined ascending channel pattern. This pattern is indicative of a series of higher lows and higher highs in the short term, demonstrating a controlled and sustained bullish trend.
The bulls’ immediate objective will be to push the LINK price toward the resistance line of this ascending channel. At this upper boundary, the bears are expected to mount a strong defense, attempting to halt the upward momentum and potentially initiate a reversal. If the price turns down sharply from this resistance line, it would suggest that the LINK/USDT pair may continue to trade within the confines of the channel for a few more days, consolidating its recent gains.

However, if buyers manage to propel the price decisively above the resistance line of the channel, it would be a significant bullish breakout, signaling the start of a stronger and more aggressive recovery. While the $11.61 level may act as an initial obstacle, a determined bullish push could overcome it, paving the way for a rally to the more substantial target of $14.98. This level represents a key long-term resistance and psychological barrier.
This article does not contain investment advice or recommendations. Every investment and trading move involves risk, and readers should conduct their own research when making a decision. While we strive to provide accurate and timely information, Cointelegraph does not guarantee the accuracy, completeness, or reliability of any information in this article. This article may contain forward-looking statements that are subject to risks and uncertainties. Cointelegraph will not be liable for any loss or damage arising from your reliance on this information.