The total Bitcoin (BTC) supply in profit currently stands at 60.6% on Thursday, a critical on-chain metric that continues to navigate a range historically associated with significant market cycle resets and subsequent bullish uptrends. This metric recently bottomed out at 50.8% on February 5, marking its lowest point since January 2, 2023. Such a substantial drop means a considerable portion of Bitcoin holders found themselves at breakeven or even at a loss, a condition that has historically prefaced robust upward price movements in the past.
The "supply in profit" metric is a fundamental on-chain indicator that quantifies the percentage of the circulating Bitcoin supply whose current price is higher than the price at which it was last moved on the blockchain. Essentially, it measures the proportion of coins that would realize a profit if sold at the current market price. When this percentage declines significantly, it suggests that a large number of investors are either underwater on their holdings or barely above their cost basis, leading to reduced selling pressure from those looking to take profits and often signaling a period of accumulation.
Looking back at previous market cycles, similar conditions have consistently preceded strong upside rallies. For instance, in January 2023, Bitcoin traded at approximately $16,682 when profitability levels were comparably low, hovering around 51%. Following this period of widespread unrealized losses, Bitcoin embarked on an astonishing rally, soaring by 655% to a projected $126,000 by 2025 – a remarkable testament to the predictive power of this metric as a precursor to market bottoms. Another notable instance occurred in March 2020, amidst the initial panic of the global pandemic, when the total supply in profit plummeted below 50% as BTC traded around $6,500. This capitulatory phase was swiftly followed by an epic bull run that saw Bitcoin surge to an all-time high of $69,000 in 2021. These historical examples underscore the significance of the current profitability levels, suggesting that the market might be re-entering a crucial accumulation phase.

Bitcoin Profitability Returns to Prior Market Cycle Base Levels
Over the past five years, the 50–60% profitability range has repeatedly served as a crucial demarcation point where a substantial segment of Bitcoin holders found themselves near their initial cost basis. This phenomenon effectively compresses the network’s overall unrealized gains, thereby diminishing the incentive for holders to capitulate and sell into weakness. CryptoQuant’s data consistently highlights this range as a key zone where long-term accumulation tends to occur.
It is vital to understand that while this metric provides strong signals, it does not pinpoint an exact price bottom. Instead, it delineates a broader "accumulation zone" – a period during which astute long-term investors typically acquire Bitcoin, leading to high returns as the market recovers, and simultaneously, the prevailing downside sell pressure begins to ease. This zone is characterized by a shift from short-term speculative trading to long-term strategic positioning, as weaker hands are flushed out and stronger hands accumulate.
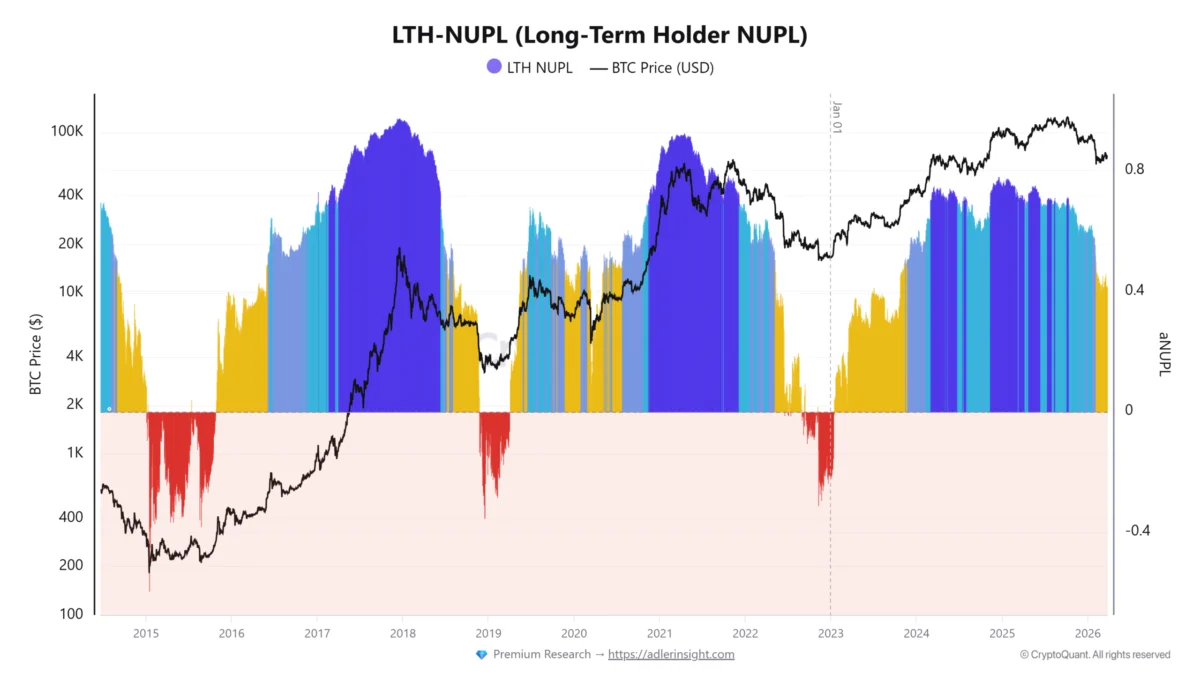
However, the current market dynamics present a nuanced picture when contrasted with other established on-chain indicators. In past cycles, definitive Bitcoin price bottoms were frequently accompanied by the long-term holder net unrealized profit/loss (LTH-NUPL) metric turning negative. LTH-NUPL measures the aggregate unrealized profit or loss of all Bitcoin held by long-term investors (typically defined as those holding for over 155 days). A negative LTH-NUPL indicates that, on average, long-term investors are holding at a loss, a condition often associated with deep bear markets and capitulation events, as witnessed during the 2015, 2018, and 2022 bear markets. These periods marked profound phases where dedicated long-term investors were holding at significant losses, paving the way for eventual market reversals.

Interestingly, despite the recent compression in the overall "supply in profit," the current LTH-NUPL reading is near 0.40. This significant deviation implies that long-term holders, despite the broader market’s profitability squeeze, are still comfortably in profit. This divergence between the general supply in profit and the long-term holder profitability highlights a fundamental shift in the market environment, one largely influenced by the evolving investor landscape.
A growing share of Bitcoin’s supply is now controlled by institutional players, including corporate entities and spot exchange-traded funds (ETFs). These participants collectively command a substantial portion of the circulating supply, close to 15.8%, representing approximately 3,319,677 BTC. These institutional entities typically operate with a longer investment horizon and exhibit a significantly lower sensitivity to short-term price fluctuations compared to retail investors. Their investment mandates often involve strategic long-term accumulation, and their holding periods extend far beyond the typical short-term trading cycles.
Consequently, the current profitability compression across the broader BTC market does not translate into the same level of forced selling from long-term holders that was characteristic of previous cycles in 2015, 2018, and 2022. This structural change in market participation helps explain why the total supply in profit can revisit historical accumulation zones, while the profitability of long-term holders remains elevated. The presence of these robust institutional players acts as a significant buffer, absorbing selling pressure and maintaining a higher floor for long-term holder profitability, even during periods of broader market consolidation.
BTC Exchange Flows Align with Valuation Models

Further reinforcing the narrative of a maturing market, recent data on exchange flows indicates a notable reduction in reactive selling pressure from newer market participants. Short-term holder (STH) BTC flows to Binance, a major cryptocurrency exchange, plummeted to 25,000 BTC on March 25. Crypto analyst Darkfost highlighted this as a new market low, a sharp decline from approximately 100,000 BTC observed during the early February sell-off. This substantial reduction in inflows to exchanges suggests a clear decrease in panic selling from short-term holders, indicating a potential stabilization of the market and a shift towards stronger hands. Less Bitcoin being sent to exchanges typically implies less intent to sell, which is a bullish signal.
In parallel, crypto analyst GugaOnChain emphasized the utility of various valuation models in identifying potential areas of deeper market stress for Bitcoin. Metrics such as the market-value to realized-value (MVRV) ratio, Net Unrealized Profit/Loss (NUPL), and the Puell Multiple have historically provided crucial insights into market sentiment and valuation.
- MVRV Ratio: This metric compares Bitcoin’s market capitalization (market value) to its realized capitalization (realized value), which is the sum of all BTC’s prices at their last movement. An MVRV ratio below 1 has historically indicated that the market value is below the aggregate cost basis of all coins, suggesting undervalued conditions and deep market bottoms.
- NUPL: As mentioned earlier, NUPL measures the total unrealized profit or loss in the Bitcoin network. Readings significantly below -0.2 have traditionally signaled periods of heavy retail capitulation and extreme fear, often preceding market reversals.
- Puell Multiple: This indicator is calculated by dividing the daily issuance value of Bitcoin (in USD) by the 365-day moving average of the daily issuance value. A Puell Multiple near 0.35 has historically coincided with periods of significant stress for Bitcoin miners, indicating that the value of newly minted coins is low relative to historical averages, often signaling undervalued conditions and potential market bottoms.
While these indicators may not precisely predict the exact market bottoms, they serve as invaluable tools for identifying "zones" where the downside risk has historically been limited relative to the long-term upside potential. By analyzing these metrics in conjunction, investors can gain a clearer, more comprehensive view of overall market positioning, helping them to make more informed decisions during periods of uncertainty. The current alignment of these various indicators, despite the nuanced LTH-NUPL data, collectively paints a picture of a market that, while not necessarily at a capitulatory bottom, is certainly in an advanced stage of consolidation, poised for potential future growth.
In conclusion, the current state of Bitcoin profitability, hovering near 50%, is a powerful on-chain signal echoing conditions seen at the cusp of previous market uptrends. While the influx of institutional capital has altered the typical "capitulation" dynamics for long-term holders, the overall compression of unrealized gains, coupled with reduced short-term selling pressure and alignment with historical valuation models, suggests that the market is in a significant accumulation phase. This period, characterized by a resetting of profitability for a substantial portion of the market, historically precedes substantial rallies, offering a compelling outlook for Bitcoin’s future trajectory.