Whale Metric Signals ETH is Bottoming Already, Setting the Stage for an Uptrend
A crucial indicator, the unrealized profit ratio for wallets holding a substantial amount of Ether—specifically those with more than 100,000 ETH—has recently crossed back above the zero threshold. This data, meticulously tracked by resource CryptoQuant, signifies a pivotal moment: this influential group of large-scale investors is no longer collectively holding onto paper losses. Instead, their Ether holdings are, on average, now in profit.
The implications of this reversal are profound. As on-chain analyst CW highlighted, similar transitions in the past, where this whale cohort moved into a "profitable state," have consistently marked the genesis of a new uptrend for Ether. This historical pattern suggests a strong correlation between the aggregate profitability of these major holders and subsequent bullish price action.
Looking back at previous instances of this signal, the data reveals a compelling trend:
- Three Months Post-Signal: ETH has, on average, delivered returns nearing 25%.
- Six Months Post-Signal: The price gains typically extended to roughly 50%.
- One Year Post-Signal: The most impressive returns were observed, with Ether’s price soaring by approximately 300%.
This historical price behavior underscores a critical psychological and market dynamic. When top ETH whales return to aggregate profit, the immediate pressure to sell defensively to cut losses diminishes significantly. This reduction in potential sell-side pressure from large holders creates a more stable foundation for price appreciation. Simultaneously, such a shift can dramatically bolster broader market confidence, signaling to other investors that the richest and often most informed ETH holders are regaining conviction in the asset’s future trajectory. This renewed confidence can trigger a domino effect, encouraging smaller investors to enter or increase their positions, further fueling the rally.
Should this historical post-signal pattern hold true, Ether could realistically target the $2,750 area by June and potentially climb above $3,200 by September, presenting a substantial upside for investors. However, it is crucial to acknowledge that no metric is infallible. A notable exception occurred in 2018, where a similar flip in the whale ratio was followed by a 17.5% drop in ETH within a month, ultimately leading to a nearly 70% tumble. This serves as a vital reminder that while historical data provides strong probabilities, market dynamics can sometimes deviate.

On-Chain Data Caps Ether’s Upside at $2,640, Reinforcing Recovery Narrative
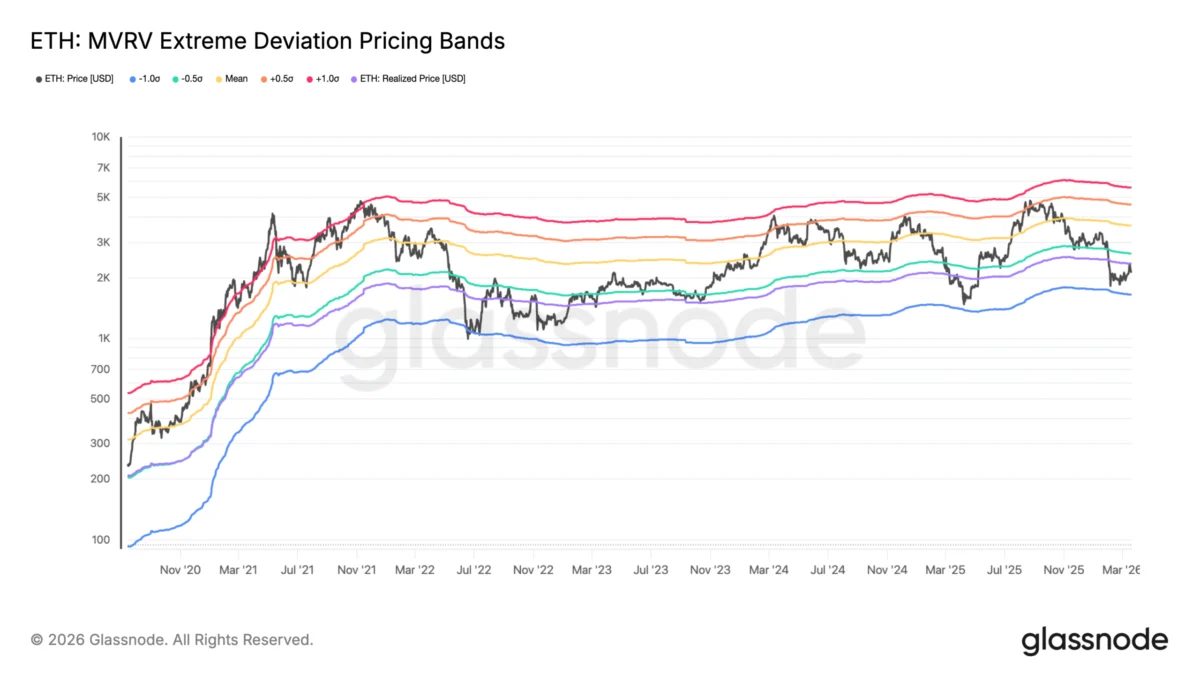
Further reinforcing Ethereum’s recovery case is another insightful on-chain signal derived from Glassnode data. This analysis shows ETH rebounding robustly from its lowest MVRV (Market Value to Realized Value) deviation band, depicted in blue on the charts. This specific setup mirrors previous recovery phases, such as those observed in Q2 2022 and other periods where Ether’s price recovered from clearly undervalued levels and successfully climbed back above its realized price.
To understand the significance, MVRV is a ratio comparing an asset’s market capitalization (market value) to the aggregate price at which all coins were last moved on-chain (realized value). A low MVRV indicates that the asset is likely undervalued, as its market price is significantly below the average price paid by investors. The deviation bands help identify extreme undervaluation or overvaluation.
At current rates, Ether remains positioned below its realized price, which currently stands at $2,353 (represented by the purple line). This realized price acts as the initial critical recovery level. A decisive breach above this threshold would be a strong bullish confirmation, signaling that the market is regaining strength and that the average investor is, at least, no longer underwater. Such a move could pave the way for Ether to target the -0.5 sigma band (teal line), which is currently situated near $2,640. This level represents a significant resistance point based on historical price distribution and investor behavior.
Conversely, a failure to reclaim the realized price could expose ETH to renewed downside risk. In such a scenario, the price could retest the lowest deviation band, which hovers near $1,651. This level would signify a return to deeply undervalued territory, potentially indicating further capitulation or a prolonged consolidation phase.
Ethereum’s Technicals Reiterate Rally Above $2,600
From a purely technical analysis perspective, Ethereum’s chart patterns are also aligning with a bullish outlook. Ether has recently executed a convincing breakout above a well-defined ascending triangle pattern. This pattern is characterized by a series of higher lows converging with a relatively flat resistance line at the top, indicating increasing buying pressure against a fixed ceiling.

Following such breakouts, it is a common and often healthy market behavior for the price to pull back towards the former resistance trendline. These "retests" are crucial as they serve to confirm that the previous resistance level has effectively flipped into new support. If the retest holds, it validates the strength of the breakout and provides a solid foundation for the next leg up.
Should the upper trendline of the ascending triangle successfully hold as support during this retest, Ether is poised to resume its recovery trajectory. The measured upside target for this particular ascending triangle pattern is typically derived from the height of the triangle and projects to around $2,625 or even higher. This technical target finds significant confluence with the broader on-chain recovery range outlined by Glassnode’s MVRV bands, particularly the -0.5 sigma band near $2,640. This alignment of both on-chain and technical indicators strengthens the overall bullish setup, suggesting a high probability of reaching these price points.
However, a failed retest, where Ether breaks back below the former resistance trendline, would significantly weaken the breakout structure. Such a scenario would increase the risk of sending ETH back toward its lower support zone, which lies between $1,950 and $2,000. This range represents a critical psychological and structural support level, and a breach below it would invalidate the current bullish technical thesis, potentially leading to further declines.
Broader Market Context and Potential Catalysts for Ethereum
Beyond these specific indicators, several broader market factors and ongoing developments within the Ethereum ecosystem could further fuel a rally. The successful implementation of the Dencun upgrade earlier this year significantly reduced transaction costs for Layer 2 solutions, making Ethereum more scalable and accessible. This improvement is expected to drive increased adoption and activity on the network, bolstering demand for ETH.
Furthermore, institutional interest in Ethereum continues to grow. Discussions around a potential spot Ethereum Exchange-Traded Fund (ETF) in the United States, following the approval of spot Bitcoin ETFs, are gaining momentum. While regulatory hurdles remain, the approval of such a product would unlock a massive influx of institutional capital, providing a substantial liquidity boost and mainstream legitimacy to ETH.
The thriving decentralized finance (DeFi) ecosystem, largely built on Ethereum, continues to innovate and attract users, increasing the utility and demand for ETH as gas for transactions and collateral in various protocols. The deflationary mechanism introduced by EIP-1559, which burns a portion of transaction fees, also contributes to a supply squeeze, potentially driving up the price over time as demand outstrips diminishing supply.

Addressing Risks and Caveats
While the confluence of these signals presents a compelling bullish case, it is imperative to approach the market with caution. The 2018 example where the whale profit metric failed to predict an uptrend highlights that past performance is not a guarantee of future results. The crypto market remains inherently volatile and susceptible to numerous external factors.
Macroeconomic conditions, such as unexpected shifts in interest rates, persistent inflation, or broader economic downturns, can impact investor sentiment across all asset classes, including cryptocurrencies. Regulatory uncertainty, particularly regarding the classification of cryptocurrencies and evolving frameworks, also poses a continuous risk. Geopolitical events, global financial crises, or even significant hacks or vulnerabilities within the crypto ecosystem could trigger rapid market downturns.
Therefore, while the current data suggests a strong likelihood of a substantial rally for Ethereum, investors are urged to conduct their own thorough research and analysis. Every investment and trading move involves inherent risks, and a well-informed decision based on individual risk tolerance and financial goals is paramount. The current signals offer a powerful narrative for Ether’s potential resurgence, but vigilance and a comprehensive understanding of market dynamics remain crucial.
This article does not contain investment advice or recommendations. Every investment and trading move involves risk, and readers should conduct their own research when making a decision. While we strive to provide accurate and timely information, Cointelegraph does not guarantee the accuracy, completeness, or reliability of any information in this article. This article may contain forward-looking statements that are subject to risks and uncertainties. Cointelegraph will not be liable for any loss or damage arising from your reliance on this information.