Bitcoin (BTC) is demonstrating persistent bullish signals as its price aggressively climbs, hitting new two-month highs near $98,000. This recent surge has captivated market participants, with a confluence of technical indicators now pointing towards significant upside potential and drawing all eyes to the pivotal $101,000 level. The cryptocurrency market is abuzz with speculation that this upward momentum could mark a definitive shift, potentially leading to a sustained rally.
The Resurgence of Bullish Momentum: A Technical Deep Dive
The current market environment for Bitcoin is characterized by renewed optimism, fueled by a combination of recovering price action and a strong alignment of key technical indicators. After a period of consolidation and uncertainty, BTC’s push towards the psychologically significant $100,000 mark is underpinned by several compelling signals. Analysts are closely watching how these indicators unfold, particularly as Bitcoin approaches critical resistance levels that could dictate its trajectory for weeks or even months to come.
Key Points Reinforcing Bitcoin’s Bullish Outlook:

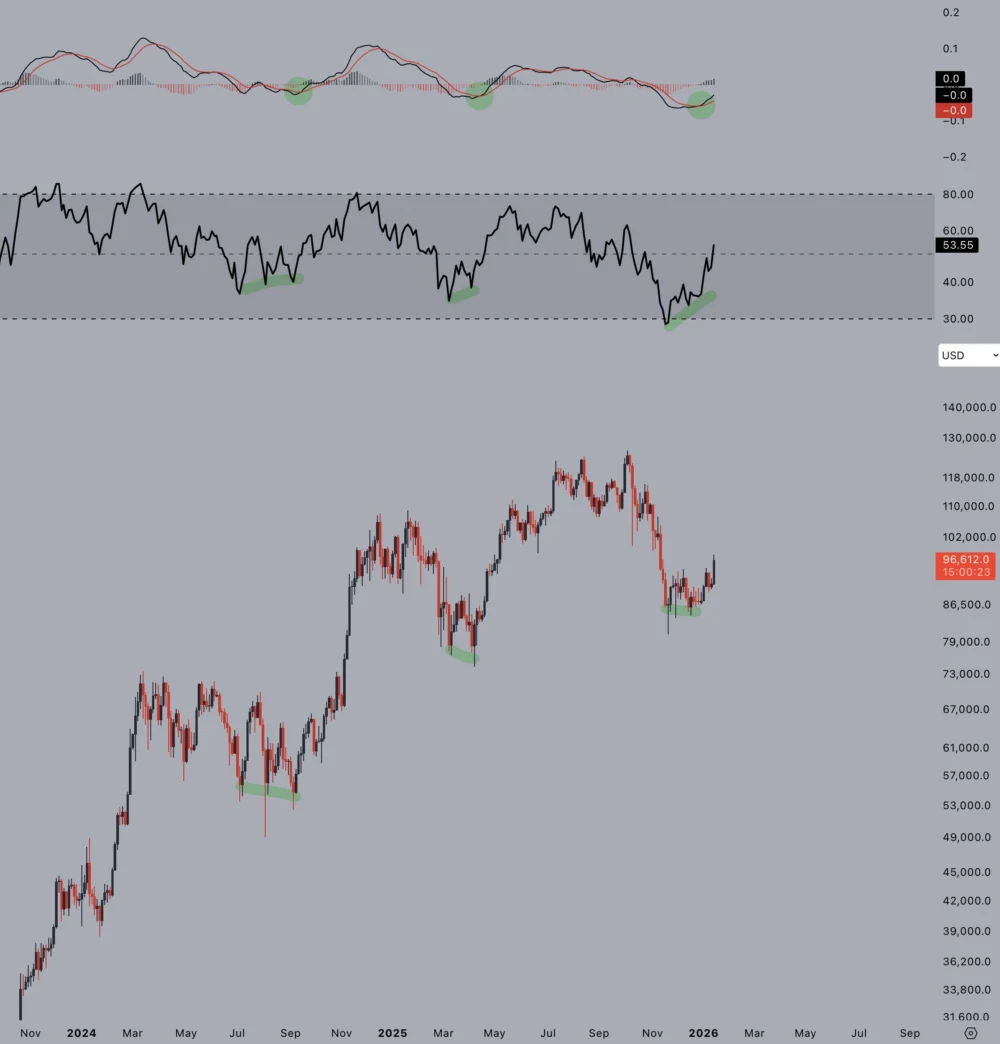
- RSI Above 50: The Relative Strength Index (RSI) has moved above its 50-midpoint on three-day timeframes, historically signaling the birth of a new uptrend.
- Hidden Bullish Divergence: Hourly charts reveal a hidden bullish divergence in RSI, suggesting underlying strength and a potential continuation of the upward trend.
- Bullish MACD Cross: A significant bullish cross on the Moving Average Convergence Divergence (MACD) indicator on the three-day chart further confirms strong buying momentum.
- $101,000 Target: The 50-week Simple Moving Average (SMA), currently situated at $101,000, represents a crucial historical resistance point that Bitcoin has never reclaimed in a bear market year.
- Bull Market Support Band Retest: The impending retest of the bull market support band is seen as a pivotal moment that will determine the immediate future direction of Bitcoin’s price.
RSI and MACD: The Classic Reversal Symphony
Data from TradingView, a widely used charting platform, unequivocally reveals that Bitcoin’s Relative Strength Index (RSI) is providing strong indications of continued BTC price upside. The RSI is a momentum oscillator that measures the speed and change of price movements, typically ranging from 0 to 100. Readings above 70 usually suggest an asset is overbought, while readings below 30 indicate it’s oversold. The 50-midpoint often serves as a crucial line, with a move above it signaling increasing bullish momentum and the potential for an uptrend.
Currently, leading indicators such as the RSI and the Moving Average Convergence/Divergence (MACD) are firmly on the side of Bitcoin bulls, both showcasing renewed strength that has caught the attention of traders. On hourly timeframes, the RSI is notably printing a hidden bullish divergence. This specific pattern occurs when the indicator makes a lower low, while the price concurrently makes a higher low. This divergence is often interpreted as a strong signal for the continuation of an existing upward trend, suggesting that despite minor pullbacks, underlying buying pressure remains robust. A similar setup was observed just last week on the four-hour chart when BTC/USD tested the $90,000 support level, foreshadowing the recent price surge.
At that time, these RSI readings had even spawned an ambitious $105,000 BTC price target. While this specific target might appear "off the table" for the immediate future given the current consolidation, the indicator itself remains anything but bearish. Its consistent positive signaling underscores the strength of the ongoing recovery.
Further emphasizing this bullish shift, trader Jelle, a prominent voice in the crypto community, highlighted the significance of the RSI’s position. In a recent X post examining three-day timeframes, Jelle noted, "RSI is now above 50, confirming the birth of a new uptrend. Send it higher." This observation is critical, as the RSI has not maintained a position above its 50 midpoint on this longer timeframe since early October. This sustained move above 50, when combined with a clear buy signal on the MACD, paints a picture that is starkly different from the bearish or sideways conditions prevalent since that period.

The MACD is another trend-following momentum indicator that shows the relationship between two moving averages of a security’s price. A bullish MACD cross occurs when the MACD line crosses above the signal line, indicating increasing upward momentum and often signaling a buy opportunity. Jelle further elaborated on the powerful combination of these two indicators: "When $BTC forms both a 3-day bullish MACD cross and bullish divergence at the same time, it’s time to pay attention. This combo marked the bottom once again." This statement underscores the historical reliability of these combined signals in identifying significant market bottoms, suggesting that Bitcoin has established a strong foundation for its next leg up.
The $101,000 Benchmark: A Historical Conundrum
Zooming out to a broader perspective, Bitcoin investor and commentator Isiah has pinpointed a unique and historically significant BTC price event that is now on the horizon. His analysis focuses on the 50-week simple moving average (SMA), a critical long-term trend indicator.
Isiah argued that if Bitcoin is indeed navigating a bear market, the upcoming reclaim of the 50-week SMA would be an unprecedented event. "The big moment is getting closer. Bitcoin has NEVER reclaimed the 50-week moving average in a bear market year (currently sitting at 101k)," he informed his X followers. This assertion carries substantial weight, implying that a successful breach and hold above $101,000 would defy historical patterns. If this level is not rejected, Isiah suggests, "this time is truly different." This statement points to a potential paradigm shift in Bitcoin’s market dynamics, possibly influenced by new factors such as increased institutional adoption, the anticipation of the next halving event, or evolving macroeconomic conditions.
Bitcoin’s price originally fell below the 50-week SMA at the start of November, marking a period of significant weakness. Reclaiming this average is not merely a technical milestone; it’s a powerful psychological signal that could transform market sentiment from cautious optimism to outright bullish conviction.

The Bull Market Support Band: The Next Critical Test
Adding another layer of analysis, the "bull market support band" now looms overhead as a key resistance task. This band, typically formed by the 20-week Simple Moving Average (SMA) and the 21-week Exponential Moving Average (EMA), has historically served as a dynamic zone of support during bull markets and resistance during bear markets. Its significance lies in its ability to dictate whether Bitcoin remains in a bullish trend or continues to struggle under selling pressure.
Trader Daan Crypto Trades articulated this impending challenge, predicting on X, "Think there’s a good chance we retest the bull market support band relatively soon. It’s moving down at a fast pace while price is attempting to grind higher." This observation suggests a convergence point where the declining resistance meets the ascending price, creating a critical juncture. Daan Crypto Trades emphasized the importance of this retest, stating, "That retest is one we see every time. Whether it breaks back above or rejects, is pretty pivotal for the next few weeks or months ahead." The outcome of this encounter will be closely watched by traders and investors, as it could confirm a sustained breakout or lead to another period of consolidation or even a downturn. A successful breach and flip of the support band into new support would solidify the bullish case, paving the way for further gains. Conversely, a rejection could see Bitcoin retreating to lower support levels.
Beyond the Indicators: What’s Driving Bitcoin’s Ascent?
While technical indicators provide crucial insights, Bitcoin’s current ascent is also bolstered by broader market sentiment and fundamental factors. The recent approval and launch of spot Bitcoin ETFs in major markets have opened new avenues for institutional capital, providing a consistent demand-side pressure. Furthermore, the anticipation of the upcoming Bitcoin halving, an event programmed to reduce the supply of new bitcoins, historically acts as a significant catalyst for price appreciation. Macroeconomic conditions, including potential shifts in global interest rates and inflationary pressures, also play a role in positioning Bitcoin as a hedge or a growth asset. The confluence of these technical signals with a generally positive fundamental outlook creates a powerful narrative for Bitcoin’s potential to move significantly higher. Growing retail interest, often spurred by price rallies, could further amplify this momentum, creating a feedback loop that propels Bitcoin towards new all-time highs.

The Road Ahead: Targets and Challenges
With $101,000 identified as a critical immediate target, the path beyond this level would likely involve testing subsequent resistance zones. While the previously floated $105,000 target might seem distant, a decisive break above the 50-week SMA and the bull market support band could quickly bring such levels back into play. However, the journey is not without potential pitfalls. Macroeconomic shocks, unexpected regulatory crackdowns, or large-scale sell-offs from major holders could introduce volatility and challenge the bullish narrative. Investors must remain vigilant and conduct thorough research, understanding that all investment and trading moves in the cryptocurrency market involve inherent risks.
Conclusion
The current alignment of Bitcoin’s technical indicators, particularly the RSI and MACD, presents a compelling bullish case. The move of RSI above its 50-midpoint, coupled with a bullish MACD cross and hidden bullish divergences, strongly suggests that Bitcoin is embarking on a new uptrend. The challenge of reclaiming the 50-week SMA at $101,000, a feat unprecedented in past bear market years, alongside the impending retest of the bull market support band, will be pivotal. Should Bitcoin successfully navigate these critical technical hurdles, the assertion that "this time is truly different" could indeed materialize, signaling a significant shift in its market trajectory and potentially paving the way for new all-time highs. The market remains on high alert, with all eyes fixed on $101,000 as the next major benchmark for the world’s leading cryptocurrency.
This article does not contain investment advice or recommendations. Every investment and trading move involves risk, and readers should conduct their own research when making a decision. While we strive to provide accurate and timely information, Cointelegraph does not guarantee the accuracy, completeness, or reliability of any information in this article. This article may contain forward-looking statements that are subject to risks and uncertainties. Cointelegraph will not be liable for any loss or damage arising from your reliance on this information.