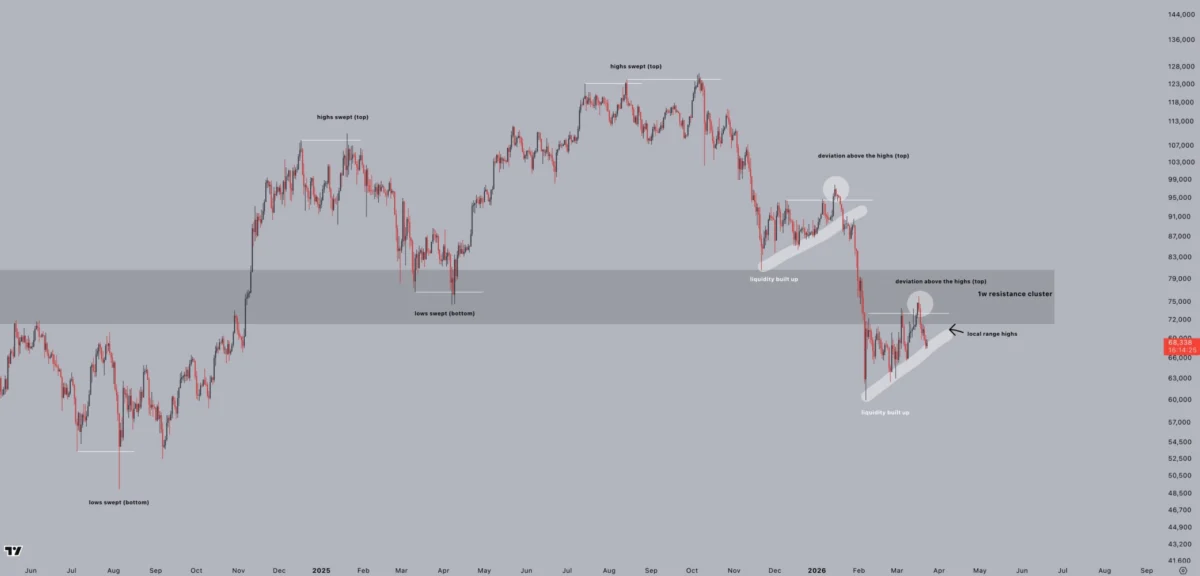
Bitcoin’s recent weekly close painted a grim picture for bulls, with the cryptocurrency failing to reclaim crucial support levels after a rough weekend of trading. Data from TradingView reveals BTC price dipping near $67,400, decisively losing control of the pivotal 200-week exponential moving average (EMA) trend line, currently situated at $68,300. This loss is a significant technical blow, as analysts had previously identified a close above the 200-week EMA as absolutely "key to protecting bulls" going forward, signaling a deeper downtrend might be underway.

Adding to the technical woes, the specter of a "bear flag" pattern looms large on Bitcoin’s daily chart. This ominous formation, characterized by a macro downtrend followed by a temporary period of relief that falsely suggests a reversal, typically resolves with a sharp drop through the flag’s bottom, resuming the downtrend to new lows. Traders are keenly aware of this pattern, having witnessed its bearish consequences in January 2026. Trader Roman, observing the market, starkly remarked on X, "It looks almost exactly the same. Bear Flag Breakdown & Retest with low volume on the upward move," after BTC/USD briefly touched six-week highs of $76,000, only to be sharply rejected. Post-weekend, trader Jelle intensified these warnings, suggesting that support had already broken, stating, "Not a great way to start the week if you’re a bull. Consolidate here for a day or two and those untapped lows look ripe for the taking." The implications are dire, with Keith Alan, cofounder of Material Indicators, projecting a bear-flag breakdown target "below $50,000," a level that would represent a significant capitulation from current prices.

The immediate-term outlook remains volatile. Trader CrypNuevo, in his latest X analysis on Sunday, predicted that the market would continue to "hinge on geopolitics," forecasting that Bitcoin could be "stuck in this range for the next month too." He further suggested a potential "conflict escalation" could trigger a "new visit to the range lows where an interesting 4h long wick still sits there," referencing Bitcoin’s sub-$60,000 swing low observed in early February. For low time frames, CrypNuevo is "favoring a potential price rotation to $65k next week," aiming to position for this around $70k, though acknowledging that acceptance above $71k would invalidate his short thesis, leading him to long to $73k-$74k. Despite the prevailing bearish sentiment, liquidations remained high into Monday, with CoinGlass data showing over $400 million erased over 24 hours. This high liquidation volume could, paradoxically, fuel a short squeeze if liquidity stacked above current prices is targeted, a scenario trader Castillo Trading considers plausible, suggesting that the risk/reward to the upside from current levels "just makes sense."

On-chain analytics platform CryptoQuant offered a nuanced perspective on the weekend’s downside volatility, characterizing it as "nothing out of the ordinary." XWIN Research Japan, a contributor to CryptoQuant, explained in a "QuickTake" blog post that "During weekends, institutional participation declines significantly, and spot-driven demand—especially from ETF flows—effectively pauses. As a result, the market becomes more dependent on derivatives positioning and short-term liquidity conditions." They further elaborated that "Lower liquidity also amplifies price sensitivity. With thinner order books, relatively small sell orders can trigger larger price movements, often leading to cascading effects such as stop-loss activation or liquidation events." Crucially, XWIN stressed that this weekend price action "should not be interpreted as a signal of trend continuation or reversal," suggesting that these movements are more noise than signal in the broader context.

However, the external macro environment paints a far more definitive picture of distress. Gold, the perennial safe haven, has officially entered bear market territory, plummeting over 20% from its all-time high. The precious metal hit local lows of $4,099 per ounce, a level not witnessed since November 2025, driven by the worsening global energy crisis and geopolitical tensions centered on the Middle East. This significant downturn in gold, a traditional flight-to-safety asset, is a potent indicator of severe market anxiety. The Kobeissi Letter, a prominent trading resource, hinted at the scale of the sell-off, suggesting that "The sporadic moves in price could signal that a potential large player in the space is being liquidated." They also noted that "rising US 10-year treasury note yields were beginning to weigh on various asset classes," further exacerbating the illiquidity in the market. "Combine this with headline fatigue and ‘pockets’ of illiquidity in the market, and the massive gaps to both directions are only growing," they added, concluding ominously, "Something big is happening metals markets right now."

The geopolitical backdrop, particularly the ongoing uncertainty over oil flows through the Strait of Hormuz, continues to push crude oil prices towards the $100 mark. Mosaic Asset Company, in its "The Market Mosaic" newsletter, underscored the potential inflationary impact, noting, "Oil prices are directly correlated to headline inflation, where a $10 increase per barrel can push inflation higher by 0.20% or more. And even before the outbreak of conflict in the Middle East, there are growing signs that inflation is already inflecting higher." This resurgence of inflationary pressures complicates the Federal Reserve’s monetary policy, contributing to the hawkish tone observed at last week’s meeting.

Indeed, the Fed’s conservative stance remains a significant headwind for risk assets. After leaving interest rates unchanged, Chair Jerome Powell emphasized that any future loosening of policy would depend on "progress" being made on inflation. Mosaic Asset Company highlighted the market’s swift reaction, stating, "As a result, the market is quickly repricing the outlook for rate cuts." Market-implied odds now suggest no further rate cuts for "over a year," with some indicators even hinting that "rate hikes could be in store." This hawkish pivot comes despite weakening US labor-market conditions, traditionally a catalyst for reassessing restrictive policy measures, underscoring the Fed’s commitment to taming inflation even at the expense of economic growth.

Amidst this gloomy outlook, Bitcoin’s long-term holders (LTHs) are clearly feeling the pinch. CryptoQuant research reveals "capitulation" signals from the Spent Output Profit Ratio (SOPR) metric, which tracks whether coins moving on-chain are doing so at a profit or loss relative to their previous transaction. A SOPR reading below 1 indicates that the observed supply is moving at a loss. Contributor The Enigma Trader highlighted a striking instance: "On March 11, the Bitcoin Long-Term Holder SOPR dropped to 0.64, meaning long-term holders were selling their coins at a 36% loss relative to their cost basis. This is one of the most extreme LTH capitulation readings in recent months." Such a deeply negative reading "indicates that even patient, conviction holders were being shaken out, a sign of genuine fear in the market." Intriguingly, despite the LTH capitulation (with the 30-day moving average of LTH-SOPR still below 1), large tranches of BTC are simultaneously leaving exchanges, suggesting a potential emerging accumulation trend. The Enigma Trader posited, "One possible interpretation: while long-term holders were capitulating between March 10–20, a separate cohort was quietly absorbing supply and moving coins off exchanges. Distribution and accumulation happening simultaneously, a classic phase transition setup." This suggests a battle between conviction and fear, with new hands entering the market even as old ones depart at a loss.

Despite the prevailing headwinds, a potential silver lining could emerge for risk assets in the form of historical patterns. Crypto’s positive correlation with US stocks has recently grown, meaning a rebound in traditional equities could offer a much-needed lift. Mosaic Asset Company noted that "Conditions across breadth and sentiment are evolving to support a rally in the S&P 500. At the same time, historic precedent for market movements around major geopolitical events also hint that a rebound could be in store for the stock market." The Kobeissi Letter echoed this sentiment, reporting "skyrocketing" trading activity across stocks and highlighting last week’s "largest March triple-witching in at least 30 years," where ~$5.7 trillion in options tied to US stocks, indexes, and ETFs expired. This massive volume of expired options "has released billions in capital, which could drive significant market swings this week. Brace for more market volatility," they warned, suggesting that this freed-up capital could find its way back into risk assets.

As Bitcoin navigates these turbulent waters, the coming week, while light on key inflation reports, will focus on jobless claims and S&P Flash Purchasing Managers Index (PMI) data – releases to which crypto has shown sensitivity recently, especially with US manufacturing finally on the ascent. However, the dominant narrative remains one of caution, with the confluence of gold’s bear market, escalating geopolitical tensions, a hawkish Fed, and significant technical breakdowns painting a stark picture for Bitcoin traders. The question is no longer if new lows are possible, but rather how deep the correction will be, with the $50,000 mark now a tangible concern on many traders’ horizons.