On Sunday, Bitcoin (BTC) saw a decisive surge, with market participants eagerly watching for the asset to solidify its position above the psychologically important $70,000 threshold. This attempt at a sustained breakout followed a period of intense volatility, with price action topping out just shy of the $72,000 level before experiencing a slight cooling phase. Despite this minor retracement, the underlying momentum remained robust, positioning BTC/USD for its seventh consecutive daily green candle. Such a consistent run of positive daily closes underscores a significant shift in short-term sentiment, hinting at sustained buying pressure following a recent correction.

The significance of this weekly close extends beyond the mere psychological barrier of $70,000. Bitcoin’s price successfully held above several long-term critical levels. Foremost among these is the 200-week Exponential Moving Average (EMA), a metric widely regarded by analysts as a crucial indicator of Bitcoin’s long-term market health and trend. Historically, maintaining price above the 200-week EMA signals a bullish outlook, while a sustained drop below it has often preceded prolonged bear markets. Reclaiming this line, especially after a period of retesting, is a powerful affirmation of the market’s resilience. Furthermore, BTC also managed to stay above its previous all-time highs from 2021, specifically $68,300 and $69,400. These levels, once formidable resistance points, now serve as robust support, strengthening the foundation for potential further gains. The weekly chart, often observed with the 200 EMA overlay, visually confirmed this critical reclaim, painting a picture of a market steadfastly consolidating its upward trajectory.
Delving into the recent market dynamics, prominent crypto trader Michaël van de Poppe offered insights into the price movements. He characterized Friday’s correction on Bitcoin as primarily a result of "risk-off appetite" among traders opting to reduce their exposure heading into the weekend. This phenomenon, common in traditional and crypto markets alike, often sees investors closing positions to mitigate unforeseen risks that might materialize during off-hours. Van de Poppe emphasized that this was "Nothing else," suggesting the dip was not indicative of a fundamental weakness but rather a temporary precautionary measure.

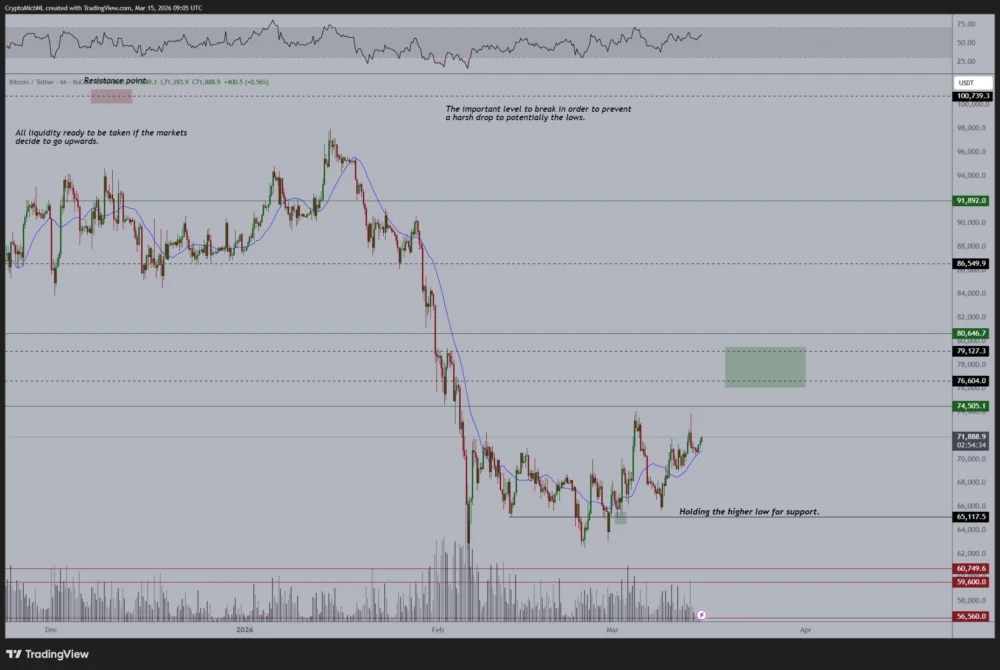
Looking ahead, van de Poppe’s analysis remained bullish. He noted that "Markets are turning back upwards again," projecting a continued grind towards higher resistance levels. He anticipated a "slight pullback later today for CME gap closing appetite," a common occurrence where Bitcoin’s price tends to fill gaps left on the CME Group’s Bitcoin futures chart when traditional markets close. These gaps arise because Bitcoin trades 24/7, while CME futures have defined trading hours. When Bitcoin’s price moves significantly outside the CME’s closing price before it reopens, a "gap" is created, which often acts as a magnet for price action. Van de Poppe’s forecast proved accurate, as the price did indeed revisit Friday’s closing price of CME Group’s Bitcoin futures market at $71,325, demonstrating the predictive power of such technical indicators. Following this potential gap closure, he predicted a continuation of the upward trend, targeting resistances between $75,000 and $80,000. His six-hour BTC/USDT chart visually supported this outlook, illustrating the projected path towards these higher valuations.
The overall market performance reinforced this positive sentiment. At the time of writing, BTC/USD had recorded an impressive weekly gain of more than 8%, while its gains for the month of March stood at a healthy 6.7%. These figures, as highlighted by platforms like CoinGlass which track weekly returns, underscore Bitcoin’s strong performance in the face of broader economic uncertainties. Such sustained positive returns contribute to a robust market structure, encouraging further investor confidence and potentially attracting new capital inflows. The strong weekly close not only validates the current bullish trend but also sets a promising tone for the upcoming trading sessions.

However, the broader macroeconomic landscape continued to present a complex backdrop, preventing what might otherwise be a more explosive "relief rally." Geopolitical risk remained a significant concern, constantly at the forefront of trader discussions. Ongoing conflicts and heightened international tensions globally have a tangible impact on financial markets, often leading to a flight to safety or increased volatility in risk assets. One major factor contributing to this macro turmoil was the price of WTI crude oil, which spent the week attempting to re-pass the $100 per barrel mark. This surge in oil prices is directly linked to the global oil supply shock, a situation exacerbated by geopolitical events and supply chain disruptions. High oil prices fuel inflation, potentially prompting central banks to maintain hawkish monetary policies, which in turn can dampen appetite for speculative assets like Bitcoin. The one-hour chart for CFDs on WTI crude oil clearly illustrated this upward pressure, underscoring the persistent energy market instability.
Crypto analysis host Kyle Doops elaborated on this intricate interplay between Bitcoin and macro factors. He commented on X, "If macro was calm, this sort of structure could easily turn into a relief rally. But with the current backdrop… downside risk still hasn’t really gone away." Doops’ statement highlights the delicate balance Bitcoin currently navigates, where strong internal market dynamics are constrained by external, larger-scale economic and political forces. A "relief rally" typically occurs after a period of significant selling pressure, when markets rebound sharply as immediate fears subside. However, with persistent geopolitical and economic uncertainties, such a full-fledged rebound remains subdued, as investors remain cautious.

Doops further identified a crucial mid-term trading range for Bitcoin, bordered by two key boundaries that define its current market structure. The upper bound was pinpointed at $78,400, which he referred to as the "true market mean." This level represents a fair value equilibrium derived from various market metrics, suggesting that price tends to gravitate towards it over time. The lower boundary was identified at $54,400, representing the "aggregate realized price of the current supply." This metric indicates the average price at which all existing Bitcoin supply was last moved on-chain, effectively serving as a strong on-chain support level. Understanding these boundaries provides a framework for anticipating potential price movements and identifying key areas of support and resistance from a fundamental, on-chain perspective. The BTC/USD chart with long-term trend lines, as shared by Kyle Doops, visually articulated these critical price zones, helping traders contextualize the current market behavior.
In his analysis of lower time frames, Doops also observed a consistent pattern: "Every time price pokes above $70K, sellers show up. Not panic selling… just steady profit-taking." This behavior indicates that while there’s strong demand to push the price above $70,000, a segment of the market, likely short-term traders or those who accumulated at lower prices, uses these surges as opportunities to realize profits. This "steady profit-taking" creates temporary resistance and can prevent a rapid, sustained breakout, contributing to the "grind upwards" described by van de Poppe rather than an explosive rally. This dynamic reflects a healthy, albeit cautious, market where participants are actively managing their positions and capitalizing on short-term price fluctuations.

The Bitcoin market’s latest weekly close above $70,000, coupled with the reclaim of the vital 200-week EMA and previous all-time highs, undeniably signals a robust bullish intent from market participants. Expert analyses from figures like Michaël van de Poppe reinforce the view of a market consolidating its gains and eyeing higher targets, even accounting for technical nuances like CME gaps. However, the shadow of macroeconomic turmoil, particularly escalating geopolitical risks and the persistent global oil supply shock, casts a layer of caution over the optimistic outlook. Kyle Doops aptly captures this tension, highlighting that while technical structures suggest a potential for a relief rally, the macro environment continues to introduce downside risk and promotes steady profit-taking rather than impulsive buying. As Bitcoin navigates this complex interplay of strong internal momentum and external pressures, its ability to maintain these newly reclaimed support levels will be paramount in determining its trajectory in the coming weeks and months, especially with the highly anticipated Bitcoin halving event on the horizon, which historically has been a catalyst for significant bull runs. The market remains at a pivotal juncture, where technical strength battles macro headwinds, setting the stage for what promises to be a compelling period for the world’s leading cryptocurrency.
This article does not contain investment advice or recommendations. Every investment and trading move involves risk, and readers should conduct their own research when making a decision. While we strive to provide accurate and timely information, Cointelegraph does not guarantee the accuracy, completeness, or reliability of any information in this article. This article may contain forward-looking statements that are subject to risks and uncertainties. Cointelegraph will not be liable for any loss or damage arising from your reliance on this information.