The cryptocurrency market is currently navigating a complex landscape, with Bitcoin (BTC) facing significant resistance above the crucial $70,000 threshold while bulls persistently exert upward pressure, signaling a dynamic struggle for dominance that sets the tone for altcoins. Recent data highlights strong institutional interest, with a substantial $417.95 million in inflows into spot BTC exchange-traded funds (ETFs) this week alone, bringing the total net inflows for March to an impressive $986.4 million. This consistent buying at lower price points underscores a robust demand, suggesting that many investors view dips as buying opportunities, reinforcing the bullish sentiment underpinning the flagship cryptocurrency’s long-term outlook.
However, the market narrative is not without its cautionary tales. Prominent voices like BitMEX co-founder Arthur Hayes have expressed hesitation, suggesting that the current macroeconomic environment, particularly the potential for prolonged geopolitical conflict, such as an "unfortunate war between US and Iran," could trigger a massive sell-off across both crypto and equity markets. Hayes articulates a preference to re-enter the market only when central banks resume "printing money," implying a belief that significant liquidity injections would be necessary to sustain another major rally. This divergence in expert opinion—between those seeing immediate buying signals from ETF flows and those anticipating a macro-driven correction—underscores the inherent volatility and speculative nature of the crypto asset class.
Adding to the complexity, analysts remain divided on Bitcoin’s immediate directional move. CryptoQuant contributor BorisD points to a continuous rise in BTC’s open interest, indicating a build-up of leverage in the market. This elevated leverage often precedes heightened volatility, leading to "stronger price swings, sudden directional moves, and another round of forced liquidations" as positions are unwound rapidly. Such conditions suggest that traders should brace for potential rapid price movements, which could either fuel a breakout or trigger a sharp correction depending on which side of the market gains momentum. The confluence of strong institutional buying, macroeconomic uncertainty, and increasing leverage creates a high-stakes environment for Bitcoin and, by extension, the broader cryptocurrency market.

The question on every investor’s mind is whether Bitcoin and selected major altcoins can successfully breach their overhead resistance levels and embark on new rallies. A detailed analysis of the top 10 cryptocurrencies, examining their technical charts and underlying market dynamics, is essential to gauge their potential trajectories in the coming weeks.
Bitcoin (BTC) Price Prediction
Bitcoin’s recent attempt to overcome the 50-day simple moving average (SMA) at $72,875 met stern resistance on Tuesday, signaling that bears are vigorously defending this key level. Despite this setback, bulls are actively trying to maintain the price above the 20-day exponential moving average (EMA) at $68,815. Should they succeed in establishing firm support above the 20-day EMA, the BTC/USDT pair could re-challenge the critical $74,508 resistance. This level is paramount for bears to hold, as a decisive close above it would not only invalidate the immediate bearish pressure but also complete a bullish ascending triangle pattern, a powerful technical signal often preceding significant upward moves. Such a breakout could propel Bitcoin towards a target of $84,000, setting a new all-time high and potentially initiating the next leg of its bull run.
Conversely, this optimistic outlook would be swiftly invalidated if the price reverses course and breaks below the ascending triangle’s support line, currently intersecting near the 20-day EMA. A breakdown here would suggest that bears have regained control, potentially leading to a sharp decline towards $62,500, and if that support fails, a further descent to $60,000, representing a significant retesting of prior support zones. The ongoing battle between buyers fueled by ETF inflows and sellers reacting to macro concerns will dictate Bitcoin’s short-term trajectory.

(Crypto market data daily view. Source: TradingView)
(BTC/USDT daily chart. Source: Cointelegraph/TradingView)
Ether (ETH) Price Prediction
Ether (ETH) bulls made a concerted effort to push the price above the $2,111 resistance on Tuesday, but they were met with strong opposition from bears who successfully defended the level. Undeterred, buyers are mounting another attempt to breach this resistance, along with the 50-day SMA, which sits slightly higher at $2,208. A successful breakout and sustained close above these combined overhead resistances would be a significant bullish development for the ETH/USDT pair. Such a move could trigger a strong rally, first towards $2,600, a key psychological and technical level, and subsequently towards the more ambitious target of $3,045. This upward momentum would be indicative of renewed confidence in Ethereum’s ecosystem and its ongoing developments, including the recent Dencun upgrade and anticipation around potential spot ETH ETFs.
However, if the price fails to overcome the overhead resistance and instead turns down sharply, particularly if it breaks below the $1,916 support level, it would suggest that the ETH/USDT pair is likely to remain entrenched in a consolidation phase. In this scenario, Ether could continue to trade within a range between $1,750 and $2,200 for an extended period, reflecting indecision among market participants. Traders would then be looking for clearer signals of either accumulation or distribution within this range before committing to a strong directional bias.

(ETH/USDT daily chart. Source: Cointelegraph/TradingView)
BNB Price Prediction
BNB has been exhibiting range-bound behavior, oscillating between $570 and $670 for several days, indicative of a period of indecision where neither bulls nor bears have managed to seize a definitive advantage. The technical indicators mirror this neutrality: the 20-day EMA is relatively flat at $635, and the Relative Strength Index (RSI) hovers near the midpoint, further reinforcing the notion of a temporary equilibrium between supply and demand. For buyers to gain the upper hand and break this stalemate, they must secure a decisive close above the 50-day SMA, currently positioned at $689. A successful breach of this level would signal renewed bullish momentum, potentially propelling the BNB/USDT pair towards $730, and then subsequently to $790, where bears are expected to mount a substantial challenge. This move would likely be fueled by positive developments within the Binance ecosystem, such as new Launchpad projects or increased utility for the token.
Conversely, if the BNB price turns down from its current position and breaks below the $607 support, it would suggest that the prolonged range-bound action is likely to continue. A close below the lower boundary of the range at $570 would indicate that sellers have firmly taken control, potentially leading to a deeper correction. In such a scenario, traders would anticipate further downside, as the failure to hold critical support levels could trigger stop-losses and exacerbate selling pressure.

(BNB/USDT daily chart. Source: Cointelegraph/TradingView)
XRP Price Prediction
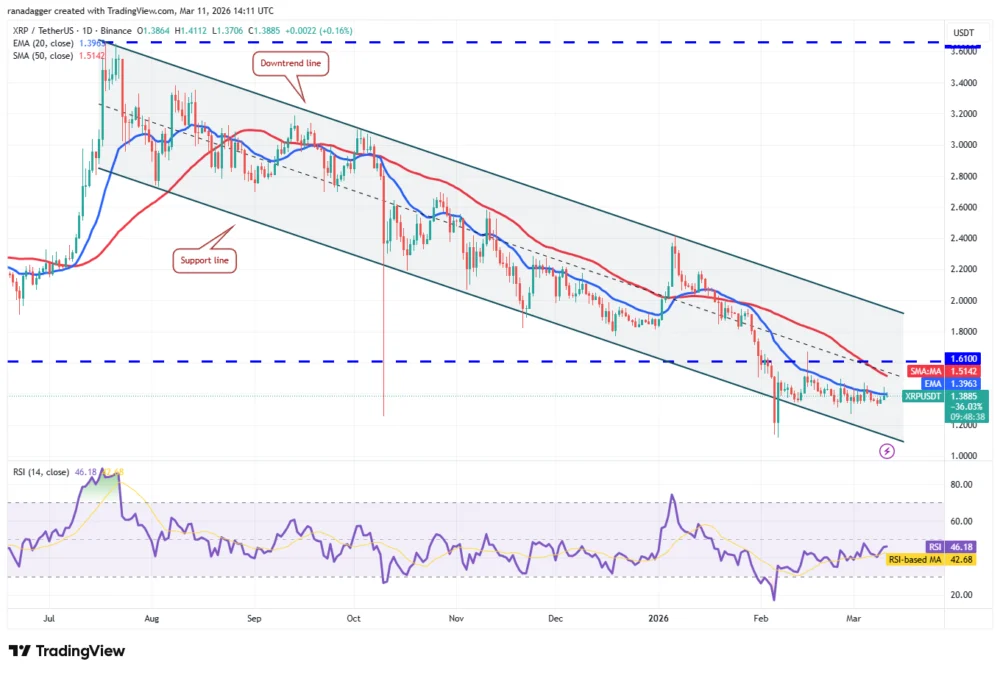
XRP recently pierced the 20-day EMA at $1.39 on Tuesday, but the long wick on the candlestick indicated significant selling pressure at higher levels, preventing a sustained breakout. Nevertheless, a glimmer of hope emerges as the 20-day EMA is beginning to flatten out, and the RSI, while still below the midpoint, shows signs of reducing selling pressure. These indicators suggest that the market might be approaching an inflection point. Buyers are expected to make another attempt to push the XRP price above the moving averages, which could open the gates for a rally towards the downtrend line of the descending channel pattern. This line represents a crucial resistance, and a break above it would be a significant bullish signal, potentially reigniting interest in XRP, especially given the ongoing developments in the Ripple-SEC lawsuit. The market is keenly watching for a potential resolution or positive news from this legal battle, which could serve as a powerful catalyst.
However, sellers are unlikely to concede easily. They will attempt to defend the moving averages fiercely and aim to pull the XRP/USDT pair below the $1.27 support level. Should they succeed, the descending channel’s support line would be at a significant risk of breaking down, which could lead to further declines. Historically, XRP has shown periods of rapid gains, such as the 1,500% rally in 2017, and some analysts draw parallels to current chart patterns, but often with the caveat that regulatory uncertainties still pose a considerable "catch."

(XRP/USDT daily chart. Source: Cointelegraph/TradingView)
Solana (SOL) Price Prediction
Solana (SOL) has been trading within a well-defined range of $76 to $95, signaling a temporary equilibrium between supply and demand. The technical indicators further confirm this consolidation: the 20-day EMA is flat at $85, and the RSI is positioned just below the midpoint, providing no clear advantage to either bulls or bears. For buyers to assert control and initiate a new upward trend, they must decisively push and maintain the Solana price above the $95 level. A successful breakout from this range would be a strong bullish signal, suggesting renewed confidence in Solana’s ecosystem, its high transaction throughput, and burgeoning DeFi and NFT activity. In such a scenario, the SOL/USDT pair could ascend towards $117, where bears are expected to make a stand and attempt to halt the rally.
Conversely, if the price fails to break above $95 and instead closes below the $76 support level, it would indicate that bears have overpowered the bulls, potentially leading to further downside. A breakdown from this range could see the pair retest the Feb. 6 low of $67, and if that critical support fails, a deeper decline to $57 would become a distinct possibility. The future direction hinges on which side can force a decisive break out of this established trading range.

(SOL/USDT daily chart. Source: Cointelegraph/TradingView)
Dogecoin (DOGE) Price Prediction
Dogecoin (DOGE) attempted to rally towards the 50-day SMA at $0.10 on Tuesday, but bulls were unable to decisively clear this resistance level, indicating active selling pressure at higher valuations. This suggests that bears remain influential in the market, actively attempting to pull the Dogecoin price below the psychological and technical support of $0.09. If sellers succeed in breaking this support, the DOGE/USDT pair could face a significant downward trajectory, potentially plummeting to the $0.08 level, and then further to the $0.06 level, which would represent a substantial loss for holders. The meme coin’s price often reacts strongly to broader market sentiment and social media trends, particularly those involving high-profile figures like Elon Musk.
Alternatively, a strong rebound off the $0.09 support would signal that bulls are fiercely defending this level, indicating underlying demand. A sustained close above the 50-day SMA at $0.10 would clear the path for a more substantial rally towards the previous breakdown level of $0.12. This level is expected to act as a significant resistance, as many traders who bought at higher prices might look to exit their positions, creating selling pressure. The ongoing battle around these key moving averages and support levels will determine Dogecoin’s short-term fate.

(DOGE/USDT daily chart. Source: Cointelegraph/TradingView)
Cardano (ADA) Price Prediction
Cardano (ADA) continues to trade within a descending channel pattern, a classic technical formation that typically indicates sellers remain in firm control of the market. Despite trading below both the 20-day EMA and 50-day SMA, a positive development is that bulls have not conceded significant ground to the bears, suggesting a degree of underlying resilience. This persistent defense increases the likelihood of a potential rally towards the downtrend line of the channel, which represents a crucial resistance level to monitor closely. A decisive close above this downtrend line would be a significant bullish signal, potentially marking a short-term trend change for ADA and indicating renewed interest in Cardano’s ongoing development, such as Hydra scaling solutions and other ecosystem upgrades.
However, if the price turns down sharply from either the moving averages or the downtrend line, it would reinforce the bearish sentiment and suggest that the ADA/USDT pair is likely to remain confined within the descending channel for an extended period. In this scenario, traders would anticipate further range-bound action or a continuation of the downtrend within the channel’s boundaries, emphasizing the need for a clear breakout to confirm a shift in market dynamics.

(ADA/USDT daily chart. Source: Cointelegraph/TradingView)
Bitcoin Cash (BCH) Price Prediction
Buyers of Bitcoin Cash (BCH) have successfully defended the crucial $443 support level, preventing a further decline. However, despite this defensive stand, they have failed to initiate a strong, convincing rebound, suggesting that upward momentum remains limited. The technical indicators lean bearish: the 20-day EMA is sloping downwards at $472, and the RSI is in negative territory, both signaling that bears retain command of the market. If the Bitcoin Cash price turns down sharply from the 20-day EMA, the likelihood of a decisive break below the $443 level increases significantly. Such a breakdown would complete a bearish head-and-shoulders pattern, a powerful reversal formation that would open the doors for a substantial fall towards $375.
Conversely, if the price manages to close above the 20-day EMA, it would suggest that bulls are attempting a comeback, potentially signaling a shift in momentum. A successful breach of the 20-day EMA could see the BCH/USDT pair climb towards the 50-day SMA, currently around $520. This level is expected to act as stiff resistance, as bears will likely defend it vigorously to prevent a sustained rally. The immediate future of BCH hinges on whether bulls can overcome the 20-day EMA or if bears can force a breakdown below $443.

(BCH/USDT daily chart. Source: Cointelegraph/TradingView)
Hyperliquid (HYPE) Price Prediction
Hyperliquid (HYPE) demonstrated resilience by bouncing off the 50-day SMA at $30.01 on Sunday, indicating that bulls are actively buying the dips and defending this key support level. This defensive action has been accompanied by positive shifts in technical indicators: the 20-day EMA has begun to turn upwards at $31.50, and the RSI has moved into positive territory. These signals collectively suggest that the path of least resistance for HYPE is currently to the upside, indicating strengthening bullish momentum. Buyers will now attempt to drive the Hyperliquid price above the $36.77 to $38.42 resistance zone. A successful breach of this zone would be a significant bullish breakout, potentially propelling the HYPE/USDT pair towards $43, and subsequently to $50, as new capital flows into the asset.
However, sellers will be looking to capitalize on any weakness. To weaken the bullish momentum and regain control, they would need to pull the price decisively below both the 20-day EMA and the 50-day SMA. If they succeed, the pair could tumble towards $25.50, invalidating the recent bullish attempts and signaling a return to bearish dominance.

(HYPE/USDT daily chart. Source: Cointelegraph/TradingView)
Monero (XMR) Price Prediction
Buyers are currently attempting to push Monero (XMR) above the 50-day SMA, which stands at $372, but they are encountering stiff resistance from bears who are vigorously defending this overhead level. The technical indicators reflect this stalemate: the 20-day EMA is flat at $346, and the RSI is positioned near the midpoint, indicating a lack of clear advantage for either bulls or bears. For a bullish scenario to unfold, buyers must decisively propel the Monero price above the 50-day SMA. A successful breach of this level would likely see the XMR/USDT pair pick up significant momentum, potentially surging towards the 61.8% Fibonacci retracement level of $414, and then further towards $452. Such a move would reflect renewed confidence in Monero’s privacy features and its underlying technology, despite ongoing regulatory pressures against privacy coins.
On the other hand, if the price turns down sharply from its current level and breaks below the $333 support, it would signal that bears remain active sellers on rallies, confirming their control. In this bearish scenario, the XMR/USDT pair could slump towards the $309 level, indicating a deeper correction and a continuation of the consolidation phase within a lower range. The outcome depends on which side can establish a decisive break from the current indecision.

(XMR/USDT daily chart. Source: Cointelegraph/TradingView)
This article does not contain investment advice or recommendations. Every investment and trading move involves risk, and readers should conduct their own research when making a decision. While we strive to provide accurate and timely information, Cointelegraph does not guarantee the accuracy, completeness, or reliability of any information in this article. This article may contain forward-looking statements that are subject to risks and uncertainties. Cointelegraph will not be liable for any loss or damage arising from your reliance on this information.