Bitcoin Reverts to a ‘Boring Bear Market’ Amidst Macro Headwinds
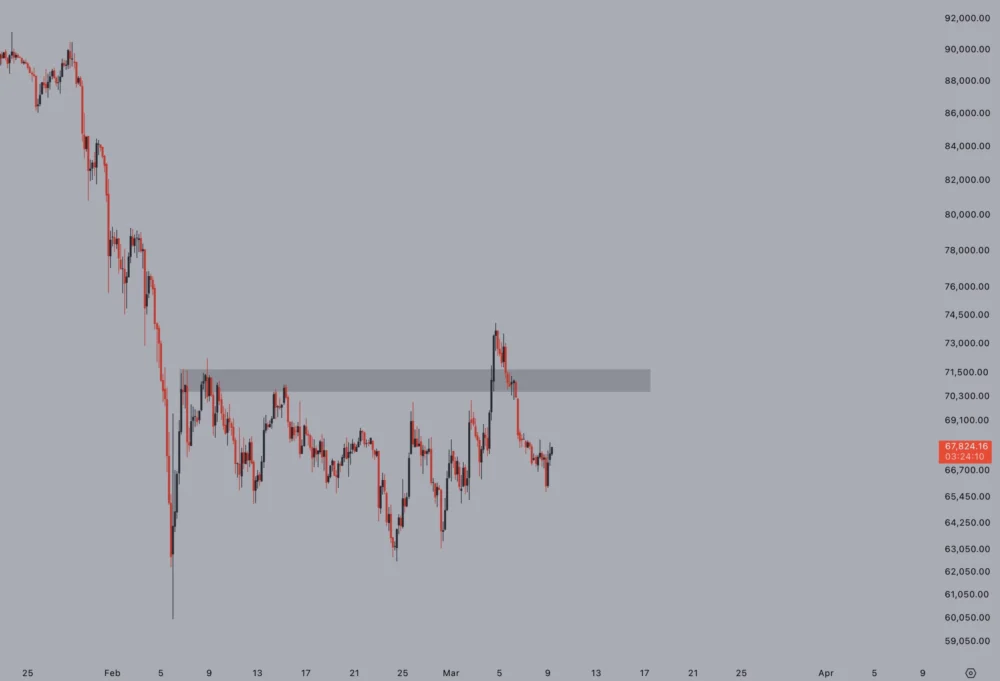
The weekend saw Bitcoin sellers exert considerable pressure, pushing BTC/USD lower into Sunday’s weekly close. The flagship cryptocurrency briefly dipped towards $65,600 on Bitstamp before a modest rebound. However, this recovery proved insufficient to prevent a critical weekly close below a key long-term trend line, a development that has analysts ringing alarm bells.

The trend line in question is the 200-week exponential moving average (EMA), a widely observed technical indicator that has historically served as a robust support level during bullish market phases and a formidable resistance during bear markets. Its loss as support is often interpreted as a strong bearish signal, implying the potential for further market downside. As Cointelegraph previously reported, this particular EMA holds immense significance for long-term market structure.
Seasoned trader and analyst Rekt Capital articulated the market’s current predicament, stating in an X (formerly Twitter) post, "Bitcoin has since almost entirely cancelled out its recovery from earlier this week. The 200-week EMA continues to act as a ceiling for price until proven otherwise." This assessment underscores the challenge Bitcoin faces in reclaiming higher price levels, with the 200-week EMA now firmly established as a resistance barrier that price struggles to overcome.
This latest price action effectively erased much of Bitcoin’s earlier trip to $74,000, a move largely influenced by broad risk-asset volatility stemming from the Middle East conflict. Adding to the prevailing bearish sentiment, trader Jelle echoed the sentiment of a stalled market: "Deviation resulted in a quick sell-off over the weekend as expected. $BTC outlook remains unchanged; it’s a boring bear market until proven otherwise." A "boring bear market" typically characterizes periods of sideways trading, lack of strong directional momentum, and investor fatigue, often marked by choppy price action within a defined range.

Despite the prevailing bearish technicals, crypto trader, analyst, and entrepreneur Michaël van de Poppe offered a more nuanced perspective, suggesting that Bitcoin’s overall price action is far from a worst-case scenario. He observed, "Bitcoin is still stuck in the range. That’s not bad, that’s actually quite strong, given: – Oil up 15% again on this Monday morning, highest level since ’22. – Gold and commodities are down – Nasdaq down substantially." Van de Poppe’s analysis highlights Bitcoin’s relative resilience compared to traditional assets, which are showing more pronounced weakness in the face of surging oil prices and broader economic uncertainty. However, even with this comparative strength, longer-term BTC price predictions continue to favor a macro bottom potentially as low as $50,000 or even lower, reflecting underlying concerns about the market’s ability to sustain higher valuations without a significant catalyst.
Oil Volatility Puts Focus on US Inflation and Fed Policy
Beyond the immediate technicals, the macroeconomic landscape is exerting immense pressure on risk assets, including Bitcoin. This week’s release of crucial US macro data is set to attract more attention than usual, primarily due to geopolitical upheaval sparking renewed inflation warnings. Key reports include the February print of the Consumer Price Index (CPI), delayed Personal Consumption Expenditures (PCE) data from January, and revised US Q4 GDP figures.

While PCE is recognized as the Federal Reserve’s "preferred" inflation gauge, the CPI is currently under a particularly intense spotlight due to its direct susceptibility to oil price fluctuations. The ongoing oil supply shock, largely centered on the Strait of Hormuz – a critical chokepoint for global oil shipments – is creating significant upward pressure on energy costs. Although the full impact of this latest surge may not be entirely reflected in February’s CPI reading, the index’s January print, which came in lower than expected, might offer little comfort if oil prices continue their ascent.
The Kobeissi Letter, a respected trading resource, highlighted the unprecedented scale of the current oil crisis, stating that the Hormuz closure represents the largest supply disruption ever recorded. It calculated the daily reduction at more than 20 million barrels, adding, "The current supply shock is roughly the same size as the top 2-6 COMBINED." Such a massive disruption inevitably sends shockwaves through global energy markets.
However, oil prices did see some cooling of their rapid rise on Monday after G7 countries reportedly considered an emergency oil reserve release, potentially totaling 400 million barrels. This move, if implemented, could provide temporary relief to the tight supply situation.

Despite potential short-term measures, trading resource Mosaic Asset Company stressed the longer-term implications of the oil crisis for the Federal Reserve and monetary policy. In its regular newsletter, "The Market Mosaic," it warned, "Rising oil and gas prices threatens to crimp consumer spending and adds inflationary pressures. The prospect for higher inflation is causing uncertainty over the outlook for monetary policy." The Fed faces a delicate balancing act: combatting inflation without stifling economic growth. Higher energy costs directly translate to increased costs for businesses and consumers, potentially leading to a resurgence of inflation, which would complicate any plans for interest rate cuts. Mosaic further noted that a previous spike in commodities coincided with the 2022 CPI top of 9%, drawing a stark parallel to the current situation. "The rally in other inflation-sensitive sectors like energy producers is sending a signal on the prospect for rising inflation as well," it added, suggesting a broader inflationary environment.
Bitcoin Death Crosses Start to Mount, Signalling Deeper Correction
Adding to Bitcoin’s woes, not only did the cryptocurrency fail to reclaim its critical 200-week EMA trend line as support during the weekly close, but it also registered a new and significant "death cross." A death cross is a bearish technical pattern that occurs when a short-term moving average crosses below a long-term moving average, typically signaling a shift in momentum towards a downtrend.

In this instance, the 21-week simple moving average (SMA) fell below its 100-week equivalent as the week concluded. This particular cross is a classic bearish signal, observed by many long-term traders, and strengthens the prospect of further BTC price downside. It implies that the average price over the last 21 weeks is now lower than the average price over the last 100 weeks, indicating weakening momentum.
Last week, Keith Alan, cofounder of trading resource Material Indicators, had already anticipated this development, suggesting that the looming death cross would "likely be a precursor to the next leg down unless we get a major bullish catalyst." This implies that even minor relief bounces are unlikely to reverse the broader bearish trajectory initiated by such a significant technical breakdown.
Furthermore, market participants are also concerned by another death cross involving lower time frames: the 50-period and 200-period SMA on the three-day chart. This specific pattern, though on a shorter timeframe than the weekly, has historically carried substantial weight. In recent analysis, trading platform TradingShot issued a stark warning, noting that bear-market death crosses on three-day time frames have historically resulted in severe Bitcoin price drops, often around 50%. Based on their analysis, which incorporates Fibonacci extensions, TradingShot suggested a potential target zone. "Given that it has also tested on two out of three past Bear Cycles the 1.618 Fibonacci extension from the level of that Death Cross, Bitcoin should be targeting the $40000 – $36000 Zone," they told X followers, indicating a significant downside potential if historical patterns repeat.

Derivatives Tease Bullish Relief, Whales Remain Patient
Amidst the barrage of bearish technical and macroeconomic signals, some glimmers of potential relief are emerging from the derivatives market. Onchain analytics platform CryptoQuant, in its latest research, points to a reversal pattern playing out on major exchange Binance’s derivatives market.
The Binance Derivatives Market Index, a composite indicator that combines various market metrics to gauge overall momentum, is currently mimicking levels observed during previous local Bitcoin price bottoms in 2024 and 2025. Contributor Amr Taha summarized in a "Quicktake" blog post, "The index recently dropped to around 0.35, a level similar to what was seen in July–August 2024, and below the 0.43 recorded in April 2025." He elaborated on the historical significance: "Historically, readings near these levels have often appeared during major Bitcoin market bottoms, before price later moved toward new highs." While Taha acknowledged that the past performance is not indicative of future results, he stressed that derivatives momentum had "weakened significantly," suggesting that the speculative froth has been largely washed out, which can often precede a healthier market rebound as the fear of missing out (FOMO) gives way to value buying.

Meanwhile, whale behavior suggests that the current panic selling appears to be predominantly a speculator’s game rather than a broad capitulation by large holders. CryptoQuant data reveals that on March 7, a spike in inflows to Binance largely originated from coins that had been active within the previous week. This contrasts sharply with an inflow event in February, where coins dormant for six to 12 months returned to Binance accounts. "Such movements are often interpreted as a potential shift in sentiment among certain investor groups, where some holders may be preparing to sell or hedge their positions," Taha explained, adding, "In many cases, deposits from older coins may reflect a growing level of caution or pessimism in parts of the market."
However, as BTC/USD surpassed $70,000 last week, Bitcoin whales notably held off on their urge to take profit. From March 1 to March 8, whale inflows to exchanges declined from $8.8 billion to $6.6 billion, according to CryptoQuant data. Taha highlighted the significance of this observation: "Interestingly, this reduction occurred while Bitcoin price fluctuated between $65,000 and $72,000, indicating that large investors were not increasing exchange deposits despite ongoing market volatility." This suggests that while smaller, short-term traders might be reacting to price swings, the deeper pockets of the market are demonstrating patience, potentially accumulating or holding firm in anticipation of future appreciation rather than capitulating to current pressures. This divergence in behavior between retail speculators and institutional-grade holders could be a crucial factor in determining Bitcoin’s trajectory in the coming weeks.