Bitcoin (BTC) bulls are increasingly confident about a move back toward the $80,000 mark in the coming weeks, fueled by a confluence of at least three compelling indicators flashing strong upside momentum. This renewed optimism comes after a period of consolidation, positioning the flagship cryptocurrency for what could be a significant price discovery phase.
Key takeaways:
- Bitcoin has successfully invalidated a potential bearish chart pattern, instead forming a bullish symmetrical triangle with a measured target pointing directly to $80,000.
- A persistent CME Bitcoin futures gap in the $79,660-$81,210 range continues to act as a powerful magnet, with historical data showing a high probability of such gaps being filled.
- Decentralized prediction markets like Polymarket reflect a sharp increase in collective bullish sentiment, with rising odds for Bitcoin to reach $80,000 in March, while downside predictions diminish.
Bitcoin Invalidates Bearish Chart Pattern, Embraces Bullish Symmetrical Triangle
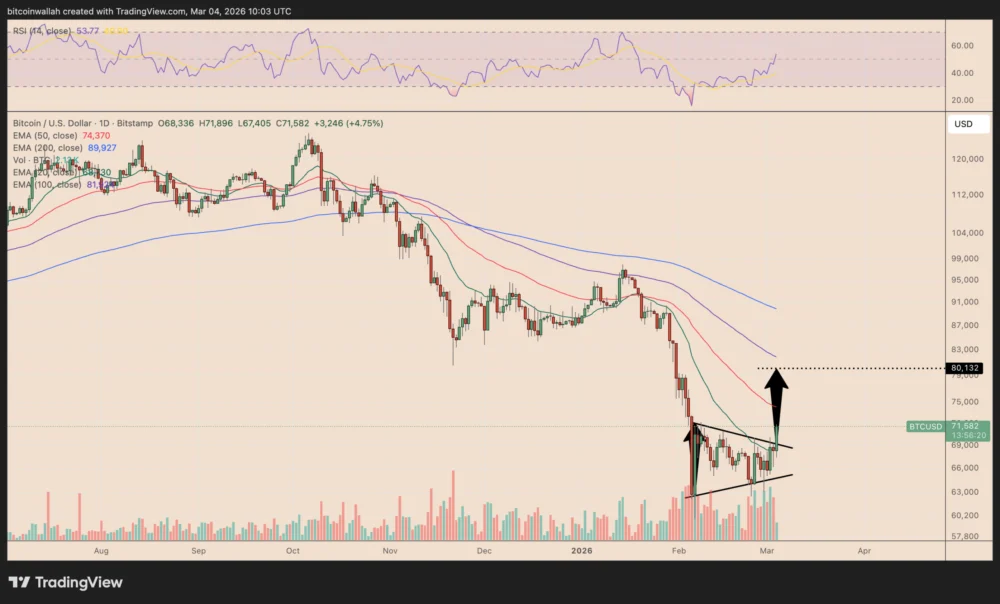
The technical landscape for Bitcoin has seen a dramatic shift, with what initially appeared to be a concerning bearish chart pattern now decisively invalidated. Earlier this week, BTC’s price action showed signs of forming a bear pennant, a continuation pattern typically signaling further downside after a sharp drop. However, this bearish outlook was swiftly countered by a powerful reversal.
On Wednesday, the BTC/USD pair executed a decisive breakout, piercing the upper trend line of the invalidated pennant. This crucial move was accompanied by a robust 5.21% surge, propelling Bitcoin to approximately $71,900. Significantly, this price jump was supported by a notable increase in trading volume, a critical factor that lends credibility and stronger conviction to any breakout. High volume indicates that a broad base of participants is supporting the move, rather than it being a low-conviction anomaly.

This invalidation of the bear pennant simultaneously paved the way for the emergence of a more optimistic structure: a symmetrical triangle, often interpreted as a bullish reversal pattern in the current market context. A symmetrical triangle forms when price action compresses into a tightening range, characterized by a series of lower highs and higher lows. This pattern reflects a period of indecision or consolidation, where neither buyers nor sellers can decisively gain control, leading to decreasing volatility.
The resolution of a symmetrical triangle occurs when the price breaks decisively above its upper trend line or below its lower trend line, moving by a distance equivalent to the pattern’s maximum height. In Bitcoin’s case, the widest range of this developing symmetrical triangle spans roughly from $63,000 to $71,000-$72,000. Applying the standard measured move principle, a sustained breakout above the upper trend line projects a target price of approximately $80,000. This target aligns remarkably well with Bitcoin’s 100-day Exponential Moving Average (100-day EMA, often a significant dynamic resistance or support level), further reinforcing its technical importance.
While the $80,000 target appears increasingly plausible, traders are also watching immediate resistance and support levels. The next significant hurdle for Bitcoin bulls lies at the 50-day EMA (red line) currently hovering near $74,400. A rejection at this level could temporarily weaken the current breakout and potentially lead to a pullback toward the 20-day EMA (green line) around $68,700, which would then act as a crucial support zone. However, if Bitcoin can overcome the 50-day EMA with conviction, the path to $80,000 would become even clearer. The confluence of a invalidated bearish pattern, a confirmed bullish breakout from a symmetrical triangle, and strong volume indicates a significant shift in market sentiment and technical strength. The ongoing inflows into spot Bitcoin ETFs, as highlighted by recent reports of BlackRock’s IBIT offsetting redemptions with $225 million in inflows, further underscore the institutional demand providing a strong fundamental backbone to these technical moves.
The Magnetic Pull of the CME Futures Gap at $80,000
Beyond the immediate technical chart patterns, another powerful force drawing Bitcoin’s price upward is an unfilled gap in the CME Bitcoin futures market, precisely at the $80,000 level. These "CME gaps" are a peculiar feature of the Bitcoin market, arising from the fact that CME Bitcoin futures contracts halt trading over the weekend, unlike the continuous 24/7 nature of the spot Bitcoin market. If the spot price of Bitcoin experiences significant movement while the futures market is closed – for instance, a sharp surge or drop over a Saturday and Sunday – the futures market will reopen on Monday at a new level, leaving an empty price zone, or "gap," on its chart from the previous Friday’s close.

As of Wednesday, a notable CME gap has been lingering in the range of approximately $79,660 to $81,210 since early February. This specific price area has become a clear magnet for bullish traders for a very compelling reason: historically, CME gaps have shown a strong tendency to be filled. For instance, a remarkable nine out of the last ten CME gaps have been filled since August of the previous year (or recent history), demonstrating a high probability that the market will eventually revisit and "fill" these empty price zones as spot and futures prices realign.
The rationale behind why these gaps tend to fill is multifaceted. Firstly, they represent a form of market inefficiency. Futures markets are designed to closely track the underlying spot asset, and a persistent gap indicates a temporary disconnect. Arbitrage opportunities often emerge, incentivizing traders to push the price back towards the gap to capitalize on these discrepancies. Secondly, these gaps act as powerful psychological levels for traders. Many institutional and professional traders actively monitor these gaps, often setting target orders or taking positions with the expectation that the market will gravitate towards them. The $79,660-$81,210 zone, therefore, isn’t just an arbitrary price point; it’s a recognized target on the radar of sophisticated market participants.
The interplay between the spot and futures markets is crucial here. While spot prices are driven by immediate supply and demand on exchanges, futures markets allow for hedging, speculation, and leverage. When a significant gap exists, it creates an imbalance that market forces naturally work to correct. The very existence of this prominent gap near $80,000 acts as a strong gravitational pull, reinforcing the technical target derived from the symmetrical triangle pattern and providing a fundamental reason for large-scale traders to aim for this zone.
Polymarket’s Prediction Market Signals Strong Bullish Conviction
Adding another layer of confidence to the $80,000 target is the surging bullish sentiment reflected on Polymarket, a prominent crypto-based prediction market. Polymarket allows users to trade contracts on the outcomes of real-world events, including financial milestones for cryptocurrencies. The prices of these contracts effectively represent the crowd’s aggregated probability for a given event to occur.

On Polymarket, traders are currently assigning a robust 40% probability that Bitcoin will reach $80,000 in March. This figure represents a significant increase from just a day prior, when the odds stood at only 20%. Even more striking is the conviction around the $75,000 target, which has soared to 70%, up from 40% in a single day. This rapid shift in probabilities indicates a strong and accelerating bullish sentiment among a collective of informed participants.
The beauty of prediction markets like Polymarket lies in their ability to aggregate dispersed information and beliefs into a single, quantifiable probability. Unlike traditional polls or surveys, participants on Polymarket put their capital on the line, incentivizing them to be as accurate as possible. This financial stake means that the odds reflect not just opinion, but a form of collective intelligence, making them a powerful sentiment indicator that can often precede price movements in conventional markets.
Furthermore, this increasing confidence in higher price targets is mirrored by a simultaneous reduction in the probabilities assigned to lower price targets. The odds of Bitcoin falling to $65,000 or $60,000 in March are now priced significantly lower than before. This dual movement – higher conviction for upside, lower conviction for downside – paints a clear picture of a market that is trimming its bearish expectations and decisively leaning towards a bullish outcome for the month. While prediction markets are not infallible and can be influenced by specific narratives or whale activity, their recent shifts provide compelling evidence of a strong and growing belief among a segment of the crypto community that Bitcoin’s upward trajectory is firmly in place.
Broader Market Context and Potential Catalysts
The confluence of these three powerful indicators – technical chart patterns, futures market dynamics, and collective sentiment – is further bolstered by the broader macro and crypto-specific catalysts currently at play. The anticipation of the upcoming Bitcoin Halving event, historically a precursor to significant bull runs, continues to underpin long-term bullish sentiment. The sustained, albeit sometimes fluctuating, inflows into US spot Bitcoin ETFs since their launch have provided a new and substantial source of institutional demand, integrating Bitcoin more deeply into traditional finance. Furthermore, a generally favorable, albeit cautious, macroeconomic environment, with potential shifts in interest rate policies, could provide additional tailwinds for risk assets like Bitcoin. This growing institutional interest, coupled with Bitcoin’s diminishing supply rate post-halving, creates a robust fundamental backdrop that supports the technical and market-based signals pointing to $80,000.

Risks and Considerations
While the bullish signals are strong, it is crucial for investors and traders to acknowledge potential risks and exercise due diligence. Bitcoin remains a highly volatile asset, susceptible to rapid price swings. Unforeseen macroeconomic shifts, such as sudden inflation spikes or interest rate hikes, could dampen investor appetite for risk. Regulatory developments, while often progressing positively, can still introduce uncertainty. Therefore, while the path to $80,000 appears increasingly logical, market participants should remain vigilant, conduct thorough research, and manage their risk exposure prudently.
Conclusion
The convergence of Bitcoin’s technical breakout from a bullish symmetrical triangle targeting $80,000, the magnetic pull of an unfilled CME futures gap in the same vicinity, and the clear bullish shift in decentralized prediction market odds paints a compelling picture for Bitcoin’s immediate future. These three distinct yet reinforcing signals suggest that the $80,000 price level is not merely an aspirational target but a next logical and increasingly probable milestone for Bitcoin bulls. As the market continues to absorb institutional interest and anticipate the halving, a successful breach of this psychological and technical barrier could set the stage for further significant gains in the ongoing bull cycle.