The recent upward momentum in the SOL/USD pair, which saw it climb as much as 13.6% from a two-week low of $75 on Tuesday, mirrors a broader market-wide recovery that has injected renewed optimism across the cryptocurrency landscape. Bitcoin (BTC), the undisputed market leader, was trading robustly at approximately $66,800, marking a 5% increase over the same 24-hour period. Ethereum (ETH), the second-largest cryptocurrency by market capitalization, also exhibited strength, gaining about 8% to trade just above $1,990. Not to be outdone, XRP (XRP) recorded significant daily gains, advancing 6% among the top 10 cryptocurrencies. This synchronized upward movement propelled the global crypto market capitalization up by 4% on the day, reaching a staggering $2.28 trillion, underscoring a pervasive bullish sentiment that SOL is riding.

Beyond the general market uplift, Solana’s surge is backed by several potent demand-side pressures. A significant factor has been the substantial short liquidations, totaling $15.4 million over the last 24 hours, as reported by Coinglass. Short liquidations occur when the price of an asset rises unexpectedly, forcing traders who bet against it (short sellers) to buy back the asset to cover their positions, thereby amplifying the upward price movement. This cascade of forced buying acts as a powerful catalyst, demonstrating intense demand-side pressure. Furthermore, institutional interest continues to solidify Solana’s position. US-based spot Solana ETFs have been a critical driver, recording a net inflow of $40 million since February 9, according to data from Farside Investors. These ETFs provide traditional investors with regulated access to Solana, signaling growing institutional acceptance and translating directly into increased buying pressure on the underlying asset. The table showcasing Spot Solana ETF flows further illustrates this institutional appetite, indicating a steady stream of capital entering the Solana ecosystem through regulated investment vehicles. This influx from global Solana investment products, coupled with significant buying activity from large holders, often referred to as "whales," collectively forms a formidable demand front that could sustainably push SOL prices higher. Data from platforms like Lookonchain frequently highlight these large accumulation events by whales, which often precede significant price movements.
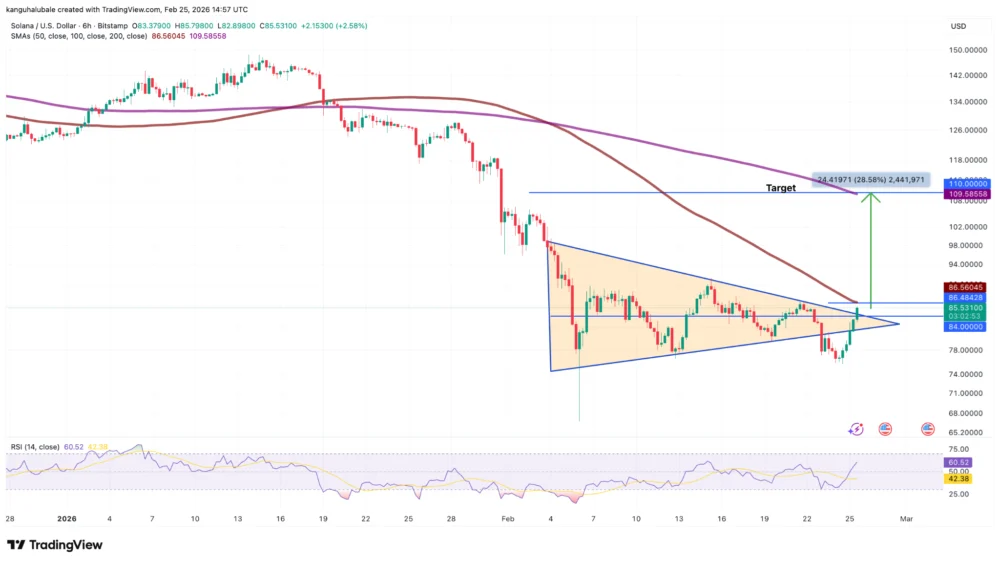
From a technical analysis perspective, Solana’s price action is signaling a compelling bullish setup. Data from TradingView indicates that SOL has successfully broken above a symmetrical triangle pattern on the six-hour time frame. A symmetrical triangle is a continuation pattern that typically forms during a period of consolidation before the price breaks out in the direction of the prevailing trend. For the upward momentum to be sustained and confirm the breakout, the price needs a decisive close above the 100-day Simple Moving Average (SMA), which currently sits at $86. This level is crucial for validating the bullish thesis and preventing a false breakout. The measured target of this prevailing symmetrical triangle pattern, calculated by adding the height of the triangle to the breakout point, is precisely $110. This target not only represents a substantial 28.5% rally from current levels but also conveniently coincides with the 50-day SMA, a key dynamic resistance/support level often watched by traders. This confluence of technical indicators at the $110 mark strengthens its significance as a potential near-term price target.

Further reinforcing the bullish outlook, as previously reported by Cointelegraph, a daily candlestick close above the 20-day Exponential Moving Average (EMA), currently positioned at $88, would unlock the path for SOL to first challenge the $95 resistance level, and subsequently clear the way for an ascent toward $117. The EMAs are particularly sensitive to recent price changes, making them valuable indicators for short-term trend analysis.
On-chain data further complements this optimistic technical picture. Glassnode’s realized price distribution data for Solana offers a fascinating insight into the historical buying activity and potential supply zones. The data reveals relatively limited historical buying activity above the $85 threshold. This is a critical observation because it suggests that there are fewer SOL holders with a cost basis above this zone who might be inclined to sell as the price recovers to their breakeven point. In simpler terms, the "path of least resistance" for SOL appears to be upward, as there are fewer immediate sellers waiting to offload their holdings, reducing the chances of significant selling pressure until the price reaches higher supply zones. The next significant resistance, according to this on-chain metric, is identified at approximately $115, a level where an estimated 22 million SOL were previously acquired. This indicates that while the journey to $110 might face minimal resistance, the region around $115 could present a more substantial selling wall, as long-term holders who bought at those levels might consider taking profits.

Beyond these immediate technical and on-chain indicators, Solana’s fundamental strength as a blockchain ecosystem cannot be overlooked. Known for its high transaction throughput, low fees, and robust developer community, Solana has emerged as a formidable contender in the smart contract platform space. Its growing ecosystem of decentralized applications (dApps), NFTs, and DeFi protocols continues to attract users and developers, contributing to the intrinsic value of its native token. Future developments, such as the ongoing work on Firedancer, a new validator client designed to significantly enhance Solana’s scalability and resilience, promise to further solidify its technological advantages and attract even more capital and innovation. The sustained institutional interest, as evidenced by ETF inflows, further validates Solana’s long-term potential and its appeal to a broader investor base seeking exposure to the high-growth blockchain sector.
However, it is crucial to acknowledge that the cryptocurrency market remains inherently volatile and subject to rapid shifts. While the current indicators strongly suggest a bullish trajectory for SOL towards $110, potential headwinds could include a broader market downturn, unexpected regulatory pressures, or a failure to sustain momentum above key technical support levels. Investors and traders should always conduct their own thorough research and consider the inherent risks associated with digital asset investments.

In conclusion, the confluence of a strong market-wide recovery, significant increases in futures open interest, substantial short liquidations, and robust institutional inflows through spot Solana ETFs has created a powerful demand-side narrative for SOL. This is further amplified by a compelling technical breakout from a symmetrical triangle pattern, targeting $110, supported by favorable on-chain data indicating limited resistance until higher price levels. While the journey in the volatile crypto market is never guaranteed, the current charts and fundamental indicators are indeed strongly hinting at a potential rally for Solana towards the $110 mark in the near term, positioning it as a key asset to watch in the coming days and weeks.
This article does not contain investment advice or recommendations. Every investment and trading move involves risk, and readers should conduct their own research when making a decision. While we strive to provide accurate and timely information, Cointelegraph does not guarantee the accuracy, completeness, or reliability of any information in this article. This article may contain forward-looking statements that are subject to risks and uncertainties. Cointelegraph will not be liable for any loss or damage arising from your reliance on this information.