Bitcoin (BTC) currently finds itself at a critical juncture, trading within a constrained $65,000–$70,000 range for the past two weeks, a pattern of consolidation that has market participants eagerly anticipating a decisive move. This period of suppressed volatility often precedes significant price action, with various technical indicators and on-chain metrics suggesting that the scales may be tipping in favor of the bulls.
The lower time frames are painting a picture of fading selling pressure, highlighted by the emergence of a bullish divergence. Concurrently, futures data reveals a strategic accumulation of fresh long positions initiated around the $66,000 mark. Analysts are increasingly pointing to this sustained compression as a precursor to a potential breakout attempt, identifying key liquidity clusters below $66,000 and above $71,000 as pivotal zones that are likely to dictate Bitcoin’s next directional thrust. The confluence of these factors creates a compelling narrative for a potential resolution to Bitcoin’s recent sideways trajectory.
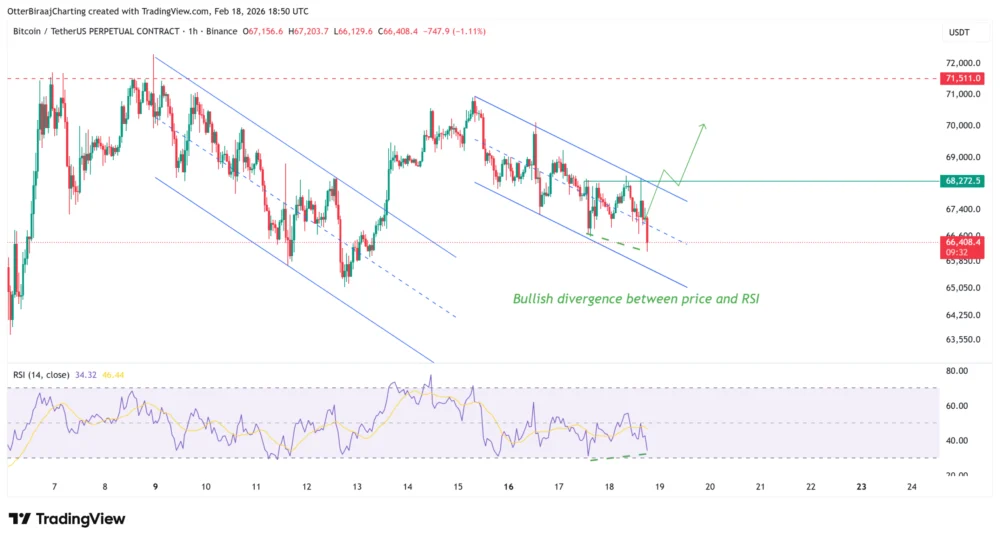
Bitcoin’s Bullish Divergence Poised at a Critical Support Level
A closer examination of Bitcoin’s one-hour chart reveals a developing technical structure that bears striking resemblance to previous patterns that have led to upward movements. Specifically, Bitcoin is carving out a descending channel, a formation that, in prior instances—such as the one observed just last week—preceded a rally towards the $70,000 threshold. Within the confines of this channel, a distinct bullish divergence has materialized in the Relative Strength Index (RSI) indicator.

A bullish divergence is a powerful signal in technical analysis, occurring when the price of an asset records lower lows or equal lows, while its corresponding momentum oscillator, the RSI, prints higher lows. This discrepancy signifies a crucial shift in market dynamics: despite the price appearing to fall or stagnate, the underlying selling pressure is demonstrably weakening. The bears are losing their grip, and the momentum is quietly building on the buy side. In this context, the RSI, a widely used momentum oscillator that measures the speed and change of price movements, is signaling that the intensity of selling is diminishing, setting the stage for a potential reversal or an upward continuation.
Should Bitcoin successfully breach the $68,000 level, it would serve as a crucial confirmation of this building momentum. Such a move is anticipated to trigger a price rally, targeting the external liquidity and a significant resistance level situated above $71,500. This level represents a key psychological and technical barrier where substantial selling interest or take-profit orders are likely concentrated. Overcoming it would imply a strong resurgence of buying conviction.
The "invalidation level" for this bullish divergence setup is strategically placed below $66,000, where internal liquidity, particularly near the $65,000 mark, resides. A breakdown below this region would not only invalidate the current divergence pattern but also shift the market’s focus towards a more significant higher-time-frame support range, specifically between $62,000 and $60,000. Traders would then need to reassess the market structure and potential downside targets.
Derivatives Market Insights: A Deep Dive into Futures Data

The derivatives market offers a rich tapestry of insights into trader sentiment and positioning. Recent data indicates that aggregated open interest (OI) in Bitcoin futures has seen a notable climb, increasing by 3% from $15.10 billion to $15.50 billion over the past two days. This increase is particularly significant given that it occurred even as Bitcoin’s price exhibited a downward drift. Rising open interest, especially during periods of price consolidation or slight pullbacks, often suggests that new money is entering the market, with traders either opening fresh long positions in anticipation of an upturn or short positions betting on further decline. In this scenario, combined with other indicators, it points more towards a bullish accumulation.
Furthermore, the aggregated funding rate, a mechanism inherent to perpetual futures contracts that ensures the contract price stays anchored to the spot price, has ticked higher to 0.046%. A positive funding rate indicates that long position holders are paying short position holders, signaling a prevalent bullish bias among futures traders. This suggests that a greater number of traders are taking long positions and are willing to pay a premium to maintain them, underscoring a collective expectation of price appreciation.
The market has also undergone a cleansing process, with approximately $250 million in aggregated long liquidations occurring since February 15, forcing over-leveraged positions to close below $67,000. While liquidations can appear bearish in the short term, they play a crucial role in deleveraging the market. By washing out excessive leverage, these forced sell-offs reduce the "overhead supply" from weak hands and create a healthier, more stable environment for a subsequent uptrend. This reduction in speculative froth allows the market to rebalance and creates better conditions for sustained price growth once fundamental buying interest re-engages.
Futures Momentum and Macro Positioning: Analyst Perspectives

Leading crypto analysts are weighing in on these market dynamics, providing additional layers of insight. Amr Taha, a respected crypto analyst, highlighted a sharp decline in the Binance Bitcoin Futures Power 30-day change. This metric, which tracks the net change in price, funding, and open interest, has fallen to -0.18. Taha notes that this level eerily matches readings last observed between April and May 2024. The historical context here is particularly compelling: similar deep negative readings in the past preceded a robust rebound that propelled Bitcoin well above the $100,000 level once the index eventually turned positive in the latter half of 2024. This historical precedent suggests that the current negative reading might signify a crucial turning point for BTC, signaling that the market may be nearing an inflection point for a significant upward swing.
Adding to this perspective, crypto analyst Dom observed that the spot order books currently display thin liquidity between $66,000 and $69,000. He characterizes the current activity as "neutral," underscoring Bitcoin’s price compression ahead of what he anticipates will be a breakout attempt. Thin liquidity means that there are fewer buy and sell orders at various price levels, which can lead to more volatile and rapid price movements once a strong directional impetus emerges. It essentially means that any significant influx of buying or selling pressure can move the price substantially without encountering much resistance.
Further corroborating the breakout narrative, liquidity heatmaps shared by prominent BTC trader Daan Crypto illustrate dense liquidity clusters positioned strategically below $66,000 and, critically, above $71,000. These clusters represent areas where a large volume of stop orders and resting positions (both buy and sell limits) are concentrated. Such zones often act as magnets for price action; when price approaches these clusters, it can either find strong support/resistance or, if broken, trigger a cascade of orders that fuels a rapid directional move. The presence of dense liquidity above $71,000 particularly reinforces the idea of a significant resistance level that, if cleared, could lead to a substantial upward surge as stop losses of short positions are triggered and new buying momentum takes hold.
The Calm Before the Storm?

Bitcoin’s current consolidation phase below $70,000 is characteristic of periods of uncertainty but also of potential accumulation before a significant move. The confluence of a bullish divergence on lower timeframes, a healthy deleveraging in the derivatives market, increasing open interest with a positive funding rate, and historical precedents from futures momentum metrics collectively paints a picture of a market gathering strength.
While the sideways action might test the patience of traders, the underlying data suggests that this compression is building pressure for an eventual expansion. The key lies in monitoring the critical levels identified: a sustained break above $68,000, followed by a decisive push past the $71,500 liquidity cluster, would likely confirm the bullish thesis and potentially launch Bitcoin towards new highs. Conversely, a breakdown below $66,000, particularly towards the $65,000 internal liquidity, would necessitate a reassessment, shifting focus to deeper support levels.
The market is poised, with the balance of power seemingly shifting towards the bulls, fueled by technical signals and a healthier derivatives landscape. As Bitcoin navigates this tight range, all eyes are on these pivotal price points and liquidity zones to determine whether this setup will indeed be the catalyst that finally ends its sideways movement and propels it into its next significant rally. The stage is set for a potentially explosive resolution to this period of calm, with market participants on high alert for the impending breakout.
This article does not contain investment advice or recommendations. Every investment and trading move involves risk, and readers should conduct their own research when making a decision. While we strive to provide accurate and timely information, Cointelegraph does not guarantee the accuracy, completeness, or reliability of any information in this article. This article may contain forward-looking statements that are subject to risks and uncertainties. Cointelegraph will not be liable for any loss or damage arising from your reliance on this information.