The AI community collectively holds its breath with each new cutting-edge large language model release from industry giants like OpenAI, Google, and Anthropic. This collective anticipation doesn’t dissipate until METR, an AI research nonprofit focused on "Model Evaluation & Threat Research," updates a now-iconic graph. This particular graph, first unveiled in March of last year, has profoundly shaped the discourse surrounding artificial intelligence, particularly by suggesting that certain AI capabilities are advancing at an exponential pace. Recent model releases have not only met but exceeded this already remarkable trend, further intensifying the AI community’s engagement.
This phenomenon was vividly illustrated with the release of Claude Opus 4.5 in late November, the latest iteration of Anthropic’s most advanced model. In December, METR’s analysis indicated that Opus 4.5 demonstrated the capability to independently complete tasks that would typically require approximately five hours for a human to accomplish. This represents a substantial leap forward, far surpassing even the predictions extrapolated from the established exponential trend. The implications were so profound that one Anthropic safety researcher publicly stated their intention to pivot their research direction based on these findings, while another employee succinctly expressed a sentiment of awe and apprehension: "mom come pick me up i’m scared."
However, the reality behind these dramatic pronouncements is considerably more nuanced. A significant factor contributing to the complexity is the substantial error margins inherent in METR’s estimations of specific model capabilities. As METR themselves articulated on X, the actual performance of Opus 4.5 could mean it regularly completes tasks requiring only two hours of human effort, or it might succeed on tasks demanding up to 20 hours. The inherent uncertainties within their methodology make definitive conclusions elusive.
Sydney Von Arx, a member of METR’s technical staff, highlights this discrepancy, stating, "There are a bunch of ways that people are reading too much into the graph." More fundamentally, the METR plot does not, and does not claim to, measure AI abilities in a generalized sense. The methodology employed by METR primarily involves testing models on coding tasks. The difficulty of these tasks is assessed by measuring or estimating the time it takes humans to complete them – a metric that is not universally accepted. Therefore, while Claude Opus 4.5 might excel at certain tasks that take humans five hours, this does not imply it is on the verge of replacing human workers across the board.
METR was established with the core mission of assessing the risks posed by advanced AI systems. Although the exponential trend plot has become its most recognizable contribution, the organization has also collaborated with AI companies to conduct more in-depth evaluations of their systems. Furthermore, METR has published several independent research projects, including a widely discussed study from July 2025 that suggested AI coding assistants might, in fact, be impeding the productivity of software engineers.
The exponential plot has undeniably cemented METR’s reputation. Yet, the organization appears to have a complex relationship with the often breathless reception its graph receives. In January, Thomas Kwa, one of the lead authors of the paper that introduced the plot, penned a blog post addressing some criticisms and clarifying its limitations. METR is also in the process of developing a more comprehensive FAQ document. Despite these efforts, Kwa expresses pessimism about their ability to significantly alter the prevailing discourse, lamenting, "I think the hype machine will basically, whatever we do, just strip out all the caveats."
Notwithstanding these concerns, the METR team firmly believes that the plot offers meaningful insights into the trajectory of AI progress. Von Arx offers a pragmatic perspective: "You should absolutely not tie your life to this graph." However, she adds with conviction, "But also, I bet that this trend is gonna hold."
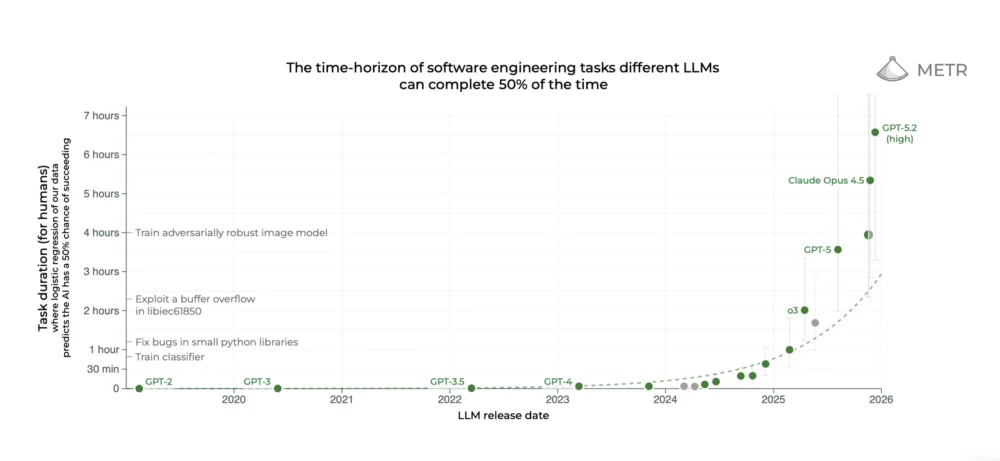
A significant part of the challenge in interpreting the METR plot lies in its underlying complexity, which often goes unnoticed. The horizontal axis is straightforward, representing the release date of each model. The vertical axis, however, is where the intricacies lie. It quantifies each model’s "time horizon," an unconventional metric developed by METR. According to Kwa and Von Arx, this metric is frequently subject to widespread misunderstanding.
To fully grasp the concept of model time horizons, it’s essential to appreciate the extensive effort METR invested in its calculation. The METR team meticulously curated a diverse set of tasks, ranging from brief multiple-choice questions to intricate coding challenges, all relevant to software engineering. Subsequently, they engaged human coders to tackle the majority of these tasks, carefully recording the time required for completion. This process established a human baseline for each task’s difficulty, with some tasks taking experts mere seconds and others demanding several hours.
When METR subjected large language models to this task suite, they observed that advanced models could effortlessly handle the shorter tasks. However, as the models encountered tasks that required more human time, their accuracy began to diminish. By analyzing a model’s performance, the researchers calculated the point on the human task time scale at which the model achieved approximately 50% success. This specific point is defined as the model’s time horizon.

This detailed explanation is readily available in the blog post and academic paper that accompanied the original time horizon plot. However, the METR plot is frequently disseminated on social media without this crucial context, leading to the true meaning of the time horizon metric being obscured. A common misconception is that the numbers on the vertical axis – such as the approximately five hours for Claude Opus 4.5 – represent the duration for which models can operate autonomously. This is incorrect. Instead, these figures indicate the amount of time it takes humans to complete tasks that a model can successfully perform. Kwa has encountered this misinterpretation so frequently that he made it a point to correct it prominently in his recent blog post. When asked what information he would add to the versions of the plot circulating online, he suggested including the word "human" whenever task completion time is mentioned.
Despite the complexity and widespread misinterpretation of the time horizon concept, it possesses a fundamental logic: a model with a one-hour time horizon could automate certain modest aspects of a software engineer’s workload, whereas a model with a 40-hour horizon could potentially complete days’ worth of work independently. Nevertheless, some experts question the efficacy of using the time humans spend on tasks as a definitive measure of AI capabilities. Inioluwa Deborah Raji, a PhD student at UC Berkeley specializing in model evaluation, posits, "I don’t think it’s necessarily a given fact that because something takes longer, it’s going to be a harder task."
Von Arx admits that she was initially skeptical about the suitability of the time horizon as a primary measure. Her conviction grew upon reviewing the results of her and her colleagues’ analysis. When they calculated the 50% time horizon for all major models available in early 2025 and plotted them, they observed a consistent increase in time horizons for top-tier models over time. Crucially, the pace of advancement was also accelerating. The time horizon was doubling approximately every seven months. This implies that the most advanced models could accomplish tasks that took humans nine seconds in mid-2020, four minutes in early 2023, and forty minutes in late 2024. "I can do all the theorizing I want about whether or not it makes sense, but the trend is there," Von Arx asserts.
It is this striking pattern that propelled the METR plot to prominence. Many individuals first encountered it through "AI 2027," a viral science fiction narrative intertwined with a quantitative forecast, which posited the potential for superintelligent AI to lead to humanity’s extinction by 2030. The authors of "AI 2027" based some of their predictions on the METR plot and cited it extensively. Von Arx reflects, "It’s a little weird when the way lots of people are familiar with your work is this pretty opinionated interpretation."
Of course, numerous individuals interpret the METR plot without invoking apocalyptic scenarios. For some AI proponents, the exponential trend signifies an imminent era of unprecedented economic growth driven by AI. Sequoia Capital, a prominent venture capital firm, recently published a post titled "2026: This is AGI," which leveraged the METR plot to argue for the imminent arrival of AI capable of functioning as an employee or contractor. Sonya Huang, a general partner at Sequoia and a co-author of the post, stated the underlying provocation was, "What will you do when your plans are measured in centuries?"
However, a model achieving a one-hour time horizon on the METR plot does not equate to its ability to directly substitute for one hour of human work in the real world. A key limitation is that the tasks used for evaluation do not fully capture the complexities and ambiguities inherent in real-world work. In their original study, Kwa, Von Arx, and their colleagues quantified the "messiness" of each task based on criteria such as whether the model was aware of its scoring mechanism and its capacity to easily restart if errors occurred. For "messy" tasks, the answer to both these questions would be no. Their findings revealed that models performed noticeably worse on these more complex tasks, although the overall trend of improvement persisted for both messy and non-messy tasks.
Furthermore, even the messiest tasks considered by METR provide limited insight into AI’s potential to undertake most jobs, given that the plot is predominantly based on coding tasks. Daniel Kang, an assistant professor of computer science at the University of Illinois Urbana-Champaign, observes, "A model can get better at coding, but it’s not going to magically get better at anything else." In a subsequent study, Kwa and his colleagues did identify exponential trajectories for time horizons in tasks across other domains, though this research was considerably less formal.
Despite these acknowledged limitations, METR’s research garners considerable admiration. Kang describes the METR study as "one of the most carefully designed studies in the literature for this kind of work." Even Gary Marcus, a vocal critic of LLMs and a former NYU professor, lauded much of the work underpinning the plot as "terrific" in a recent blog post.
While some will undoubtedly continue to interpret the METR plot as a harbinger of AI-induced doom, its true essence is far more pragmatic: it is a meticulously constructed scientific instrument that quantifies the intuitive sense of AI progress experienced by many. As METR employees readily concede, the plot is not a flawless tool. However, in a novel and rapidly evolving field, even imperfect instruments can yield substantial value.
Von Arx summarizes this duality, stating, "This is a bunch of people trying their best to make a metric under a lot of constraints. It is deeply flawed in many ways." She concludes with a powerful affirmation: "I also think that it is one of the best things of its kind."