Bitcoin (BTC) is not just flirting with a major price milestone but appears to be in the nascent stages of a robust rally, poised to reclaim the psychological $100,000 level as firm support before launching towards an ambitious $107,000 target in the coming weeks. This significant upward momentum is underpinned by a powerful confluence of favorable technical indicators, a noticeable shift in the behavior of Bitcoin’s most seasoned investors, and compelling macroeconomic signals that collectively paint a picture of a market gearing up for sustained growth. The narrative is shifting from cautious optimism to a more definitive bullish outlook, suggesting that the much-anticipated “real breakout” has indeed commenced, driven by factors that indicate both market maturity and an expanding appetite for digital assets.
1. Dominant Technical Signals Point to a Powerful Upside Trajectory
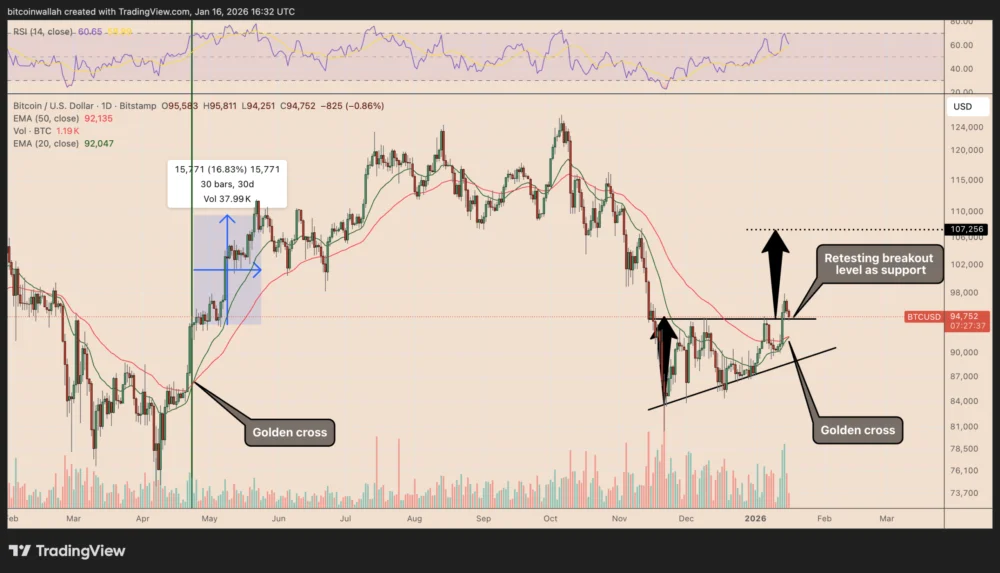
The first and arguably most immediate catalyst for Bitcoin’s anticipated surge stems from its robust technical posture, particularly the confirmation of a multi-week ascending triangle breakout and the imminent formation of a critical bullish cross on the daily chart. Earlier this week, Bitcoin decisively pushed above the upper boundary of its ascending triangle pattern, a classic bullish formation characterized by a rising lower trendline and a flat upper resistance. This pattern typically signals that buyers are consistently stepping in at higher lows, gradually building pressure against a strong resistance level until it eventually gives way.

Following the initial breach of the $95,000 resistance, BTC executed what technical analysts describe as a textbook post-breakout retest. This crucial phase involves the asset pulling back to the newly conquered resistance level, which then acts as new support. Bitcoin’s successful bounce from this reclaimed level is a strong confirmation of the breakout’s validity, differentiating it from a potential false breakout or "fakeout." The resilience shown at this critical juncture suggests that the market is validating the new price floor, thereby solidifying the structural integrity of the "real breakout." According to the principles of technical analysis, the measured upside objective of an ascending triangle is derived by adding the pattern’s maximum height to the breakout point. In this case, this projection targets the $107,000 mark, with many analysts forecasting this achievement as early as February, provided the current momentum is sustained. This target represents not just a new local high but a significant psychological barrier being overcome, potentially paving the way for further expansion.
Compounding this bullish technical picture is the impending "bull cross" on Bitcoin’s daily chart, specifically involving the 20-day Exponential Moving Average (EMA) crossing above the 50-day EMA. Moving averages are widely used by traders to identify trend direction and potential shifts. An Exponential Moving Average gives more weight to recent prices, making it more responsive to new information. A bull cross, often referred to as a "golden cross" when longer-term moving averages are involved, is a highly regarded buy signal, indicating a shift from a short-term downtrend or consolidation to an uptrend. Historical data lends significant credibility to this signal; the last time BTC printed a similar bull cross, the price of Bitcoin advanced by approximately 17% over the subsequent month. If this historical precedent holds true, the confirmation of such a cross would further strengthen the case for a sustained trend continuation, adding another layer of conviction for market participants. The convergence of these two potent technical signals – a validated chart pattern breakout and a powerful trend-following indicator – offers a compelling argument for Bitcoin’s imminent push towards higher valuations.
2. Long-Term Holders Show Reduced Selling Pressure, Signaling Supply Squeeze

Beyond the charts, a fundamental shift in the behavior of Bitcoin’s most steadfast investors – the long-term holders (LTHs) and "OG" (original gangster) Bitcoin holders – is providing a powerful undercurrent to the current rally. These are the investors who have held their Bitcoin for extended periods, often through multiple market cycles, and their spending patterns are a critical indicator of market sentiment and potential supply dynamics. On-chain data tracking Unspent Transaction Outputs (UTXOs) from these seasoned holders, particularly coins dormant for more than five years, reveals a significant deceleration in selling pressure.
Early in the current market cycle, coinciding with the excitement around the launch of spot Bitcoin Exchange Traded Funds (ETFs) and the subsequent surge in institutional demand, there was a noticeable uptick in selling by these OG holders. This period saw the 90-day average of spent outputs peak near 2,300 BTC, reflecting an "unusually attractive exit window." For many long-term holders, the influx of new, deep-pocketed institutional capital via ETFs presented an unprecedented opportunity to realize substantial gains without significantly impacting market liquidity. This phenomenon was a natural response to a sudden and massive increase in demand. However, as of January, this trend has dramatically reversed, with the 90-day average of spent outputs declining sharply toward the 1,000 BTC level. This reduction signifies a material decrease in the number of dormant coins entering the market, suggesting that the initial wave of profit-taking from these venerable investors has largely subsided.
Analyst DarkFrost from CryptoQuant highlighted this crucial shift, stating, "Their selling pressure, which can sometimes be massive, has clearly decreased, and the prevailing trend now seems to lean more toward holding rather than distribution." This change in behavior is profoundly bullish. When long-term holders, who control a significant portion of Bitcoin’s circulating supply, opt to hold rather than sell, it effectively reduces the available supply on exchanges, making Bitcoin more scarce and susceptible to upward price movements with sustained demand. This supply-side constraint is further corroborated by data showing the largest net Bitcoin outflows from exchanges since December 2024. Net exchange outflows indicate that more Bitcoin is being withdrawn from trading platforms than is being deposited. This is typically interpreted as a bullish signal, as investors moving their coins off exchanges usually intend to hold them in cold storage for the long term, rather than for immediate sale. The combined effect of reduced OG selling and significant exchange outflows creates a powerful supply squeeze, reinforcing the potential for Bitcoin’s price to escalate as demand continues to flow into the market, particularly from the burgeoning ETF ecosystem.

3. Negative Bitcoin-Gold Correlation and Macro Tailwinds Signal Outperformance
The third compelling reason for Bitcoin’s impending breakout lies in its evolving relationship with traditional safe-haven assets, specifically gold, coupled with an increasingly favorable macroeconomic backdrop. Historically, Bitcoin and gold have often been viewed as competing stores of value, particularly during periods of economic uncertainty or inflation. However, an intriguing pattern has emerged: in past instances where Bitcoin’s correlation with gold turned negative, Bitcoin subsequently experienced significant rallies. On average, Bitcoin rallied by an impressive 56% within roughly two months following such a decoupling. The sole exception to this pattern occurred in May 2021, which was largely attributed to specific "exogenous shocks," including China’s aggressive mining crackdown and a cascade of forced deleveraging within the crypto ecosystem – events not indicative of underlying market weakness but rather external pressures.
As of 2026, the current setup appears significantly more favorable for Bitcoin to replicate, and potentially exceed, these historical performances. This is largely due to two critical macroeconomic tailwinds: rising global liquidity and the anticipated end of the Federal Reserve’s quantitative tightening (QT) program. Global liquidity refers to the ease with which assets can be bought and sold in financial markets, often influenced by central bank policies. An increase in global liquidity typically means more capital is flowing into the financial system, seeking returns, which often benefits risk assets like Bitcoin. The Federal Reserve’s QT program involved reducing its balance sheet, effectively draining liquidity from the financial system, which can be a headwind for asset prices. The expected cessation of QT, and a potential shift towards more accommodative monetary policies, would inject fresh liquidity back into the markets, creating a more fertile environment for Bitcoin’s growth.

Further reinforcing this macro-bullish thesis, Matt Hougan of Bitwise, a prominent asset manager, highlighted that Bitcoin bull markets have historically coincided with expanding global M2 supply. M2 money supply is a broad measure of the amount of money in circulation, including cash, checking deposits, and easily convertible near money. An expanding M2 supply often reflects a period of monetary easing and increased liquidity in the economy. Hougan’s insights suggest that the ongoing monetary easing cycle, driven by various global central bank postures, could strategically position Bitcoin to significantly outperform gold in 2026. This dynamic would further solidify Bitcoin’s narrative as a superior digital store of value and a hedge against inflation in an environment of increasing fiat currency supply. The combination of a historically bullish negative correlation with gold and a supportive global liquidity environment provides a robust macro-level argument for a sustained breakout, driving Bitcoin towards higher price echelons and reinforcing its position as a leading asset in the evolving financial landscape.
In conclusion, the convergence of these three powerful forces – an unequivocal technical breakout validated by classic chart patterns and trend indicators, a significant reduction in selling pressure from Bitcoin’s most steadfast holders, and a macro environment increasingly conducive to digital asset growth – creates a compelling foundation for Bitcoin’s ascent. The path toward $100,000 as a new support level and the ambitious target of $107,000 is not merely speculative but appears to be a logical progression driven by fundamental shifts in market dynamics and investor psychology. As these catalysts continue to unfold, Bitcoin is poised to reaffirm its position as a leading asset, demonstrating a "real breakout" that could redefine its valuation trajectory in the coming months.
This article does not contain investment advice or recommendations. Every investment and trading move involves risk, and readers should conduct their own research when making a decision. While we strive to provide accurate and timely information, Cointelegraph does not guarantee the accuracy, completeness, or reliability of any information in this article. This article may contain forward-looking statements that are subject to risks and uncertainties. Cointelegraph will not be liable for any loss or damage arising from your reliance on this information.