

 anjir abdul
Bitcoin (BTC) has been locked in a challenging battle to firmly establish the $80,000 mark as a foundational support level in recent days, a struggle that has kept many market participants on edge. However, according to cutting-edge research from leading crypto analytics platform Glassnode, the true gauntlet for Bitcoin bulls is yet to be thrown. The firm’s latest analysis suggests that the real test of demand, and a significant hurdle for any sustained upward momentum, lies just ahead, specifically within a critical price band above $81,000, where a confluence of "overhead liquidity structures" indicates a substantial thickening of potential selling pressure.
Glassnode Pinpoints Key Overhead Liquidity Structures Between $81,000 and $86,000
In its widely respected weekly newsletter, "The Week Onchain," Glassnode delved deep into on-chain data to identify multiple significant pools of Bitcoin that could be poised for release into the market should prices climb further, particularly below the $86,000 threshold. This comprehensive analysis paints a clear picture of the supply-side dynamics awaiting Bitcoin as it attempts to break higher.
Of paramount interest in this impending supply zone are the actions of Long-Term Holders (LTHs). These are defined by Glassnode as wallets that have held their Bitcoin without selling for a minimum of six months, often much longer. LTHs represent the conviction segment of the market, investors who have typically weathered market volatility, including significant drawdowns, demonstrating a strong belief in Bitcoin’s long-term value. Glassnode highlights that a substantial portion of the supply between $83,000 and $86,000 consists of coins held by these LTHs.
"Above, the first heavy structure is $83K-86K, and effectively all of it is long-term holder supply that has sat through the entire drawdown," Glassnode stated in its report. This observation carries significant weight, as reaching the $83,000 level would effectively bring many of these patient holders to a breakeven point, or a modest profit, after potentially enduring considerable paper losses or prolonged periods of sideways consolidation. The psychological impact of finally reaching profitability after a protracted hold could trigger a wave of profit-taking or a desire to exit at cost, thereby testing the true resolve and conviction of this crucial cohort. The ability of new demand to absorb this potential LTH selling without a significant price correction will be a definitive indicator of the market’s underlying strength.
Adding another layer to this thickening liquidity, Glassnode observes a notable increase in new "ask liquidity" on exchange order books within the same critical zone. Ask liquidity refers to the volume of sell orders placed by traders and investors, indicating potential supply waiting to be matched with buying demand. While some of these orders might represent genuine selling interest, Glassnode also notes that some owners of this ask liquidity may not necessarily intend for their orders to be filled. Instead, these strategically placed orders, often referred to as "laddering" or "spoofing" (though the latter implies malicious intent and is regulated in traditional markets), can serve to create a perceived resistance ceiling, aiming to keep the spot price above a certain level or to create opportunities for accumulation at lower prices if the market dips. Regardless of intent, the sheer volume of these ask orders contributes to the overall supply wall that Bitcoin must overcome.

Glassnode’s analysis further meticulously details the convergence of multiple independent structures, all pointing to this narrow price band as a critical resistance zone. The report specifies: "The re-laddered asks join a stack of independent structure pointing at one zone. The first self-custody cost-basis shelf begins at $80.8K, dealer gamma flips negative at $82.3K, the surviving liquidation shelf runs to $86K, and the patient-supply wall fills $83K-86K."
Let’s break down these technical terms for clarity:
- Self-custody cost-basis shelf at $80.8K: This refers to the average price at which Bitcoin held in private, non-exchange wallets (self-custody) was acquired. If the price reaches this level, many self-custodied coins would be at or above their average purchase price, potentially leading to selling pressure from those looking to realize gains or simply exit positions.
- Dealer gamma flips negative at $82.3K: In options trading, "gamma" measures the rate of change of an option’s delta (price sensitivity to the underlying asset). Market makers, or "dealers," who facilitate options trading, often hedge their positions. When gamma flips negative, it implies that as the price of Bitcoin rises, dealers need to sell more of the underlying asset (Bitcoin) to maintain a delta-neutral hedge. This dynamic can amplify selling pressure, turning a resistance level into a stronger barrier.
- Surviving liquidation shelf runs to $86K: This refers to the cascading liquidations of highly leveraged positions that occur if Bitcoin’s price hits specific thresholds. As price approaches these levels, a chain reaction of forced selling can occur, creating a significant downward pressure point. While typically thought of as downside risk, these "liquidation shelves" can also represent a psychological barrier for upward movement, as traders anticipate potential volatility or short-term dips if these levels are tested.
- Patient-supply wall fills $83K-86K: This is a reiteration of the significant LTH supply mentioned earlier, emphasizing the sheer volume of Bitcoin held by patient investors ready to potentially sell in this range.
In summary, Glassnode concludes: "Every overhead structure we track now sits between $81K and $86K; that band is where the recovery’s demand meets its test." This powerful statement underscores the unprecedented confluence of supply-side indicators, making this price corridor a definitive proving ground for Bitcoin’s upward trajectory.
Trend Lines Converge on a Narrow BTC Price Corridor
Beyond Glassnode’s sophisticated on-chain analysis, traditional technical analysis indicators also corroborate the significance of the $80,000-$86,000 area as a formidable resistance hurdle. Multiple widely followed price trend lines are converging in this narrow corridor, strengthening its status as a critical battleground for bulls and bears.
According to data from TradingView, Bitcoin’s 50-week and 100-week exponential moving averages (EMAs) are currently situated at approximately $77,353 and $78,485, respectively. EMAs are technical indicators that give more weight to recent prices, making them more responsive to current market trends compared to simple moving averages (SMAs). The 50-week and 100-week EMAs are particularly significant as they represent crucial long-term sentiment and momentum benchmarks. A break above these levels, followed by sustained support, is often interpreted as a strong bullish signal, while rejection can indicate continued consolidation or downward pressure. Their proximity to the $80,000 psychological level reinforces its importance.
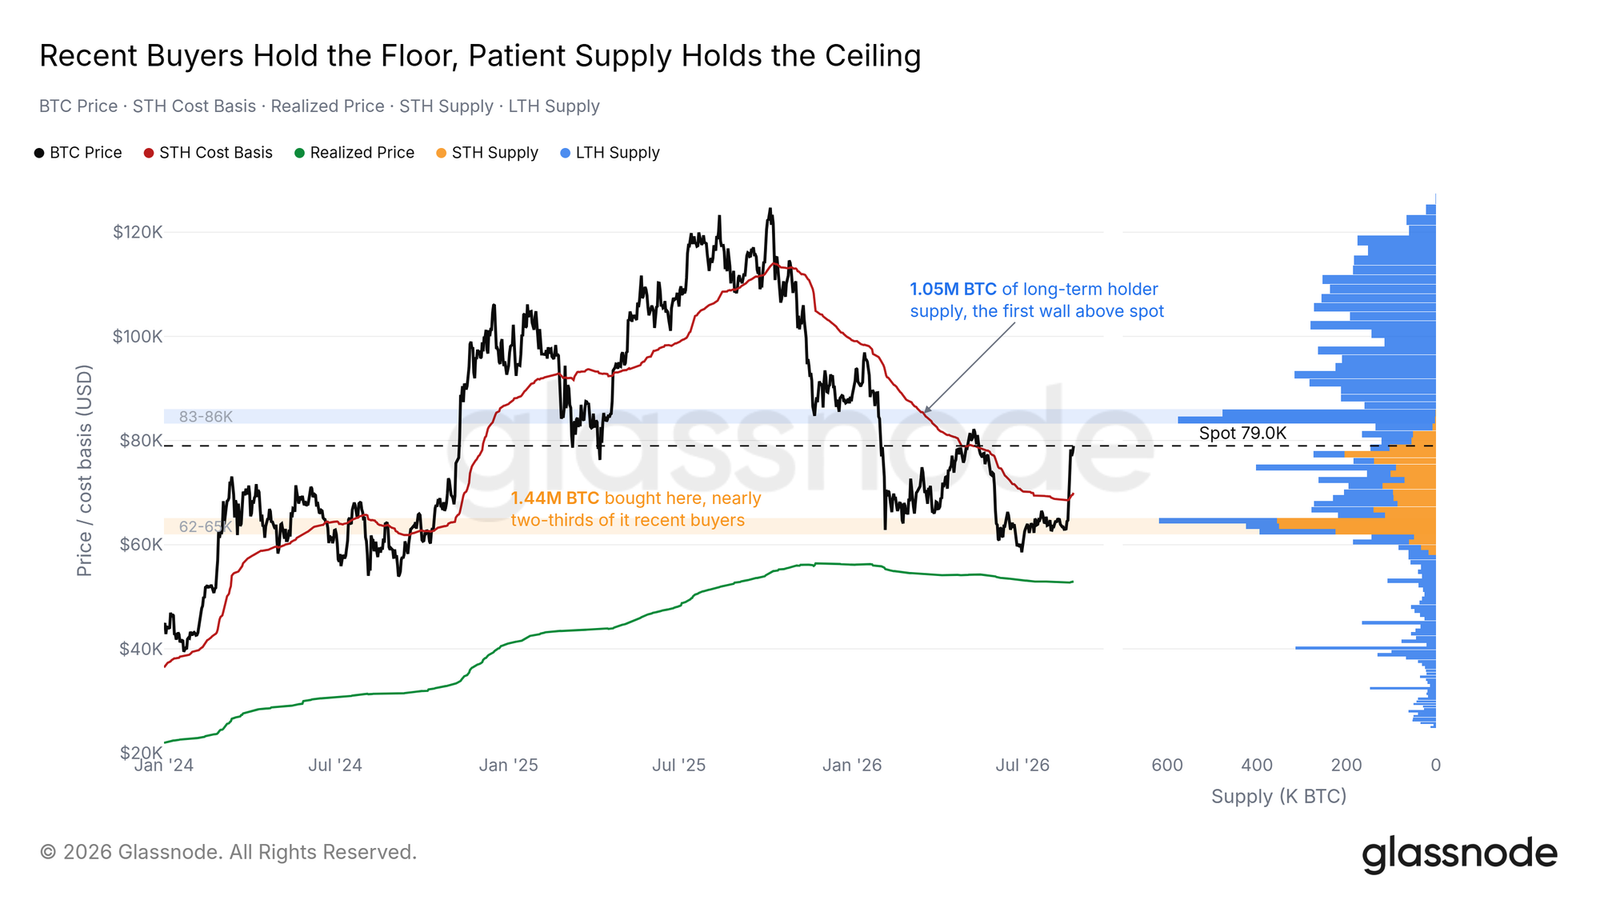
Furthermore, Bitcoin’s 365-day volume-weighted average price (VWAP), another robust moving average that incorporates trading volume into its calculation, currently hovers around $82,600. Unlike simple moving averages, VWAP gives more weight to prices at which more volume was traded, providing a more accurate representation of the average price paid by investors over a given period. The fact that the 365-day VWAP, a long-term indicator of average market entry, falls squarely within Glassnode’s identified $81,000-$86,000 resistance zone further solidifies the notion that this area represents a significant aggregate cost basis for many participants, making it a natural point for potential selling pressure. The convergence of these long-term moving averages with the on-chain supply structures paints a comprehensive picture of a market facing substantial overhead resistance.
Broader Market Context and Analyst Sentiment
The challenges facing Bitcoin at these levels are further compounded by a broader market sentiment characterized by caution, despite recent price rebounds. Cointelegraph previously reported on the skepticism among market participants regarding the sustainability of Bitcoin’s rapid recovery. Many analysts remain wary, recalling past instances of failed breakouts and prolonged consolidations.
Renowned trader and analyst Rekt Capital, for example, has consistently stressed the importance of Bitcoin holding its 50-week EMA for an extended period before any "meaningful trend change" can be confidently declared. This perspective highlights that short-term price movements, while exciting, often need to be validated by sustained performance above key long-term indicators to signal a true shift in market structure. The current "bear market timing," which some long-term models suggest could continue until the end of 2026 (likely referring to the longer-term cyclical nature of Bitcoin markets rather than an immediate forecast), further reinforces the need for strong, convincing price action to inspire widespread bullish conviction.
The current macro environment also plays a role. Factors such as global inflation rates, central bank monetary policies (particularly interest rate decisions), and geopolitical stability continue to influence investor appetite for risk assets like Bitcoin. While Bitcoin has shown periods of decoupling, it often remains sensitive to broader market sentiment. Therefore, overcoming the significant liquidity barrier identified by Glassnode would not only signify strong internal demand within the crypto market but also potentially indicate a renewed confidence that can withstand external macro pressures.
Conclusion: The Defining Moment for Bitcoin’s Recovery
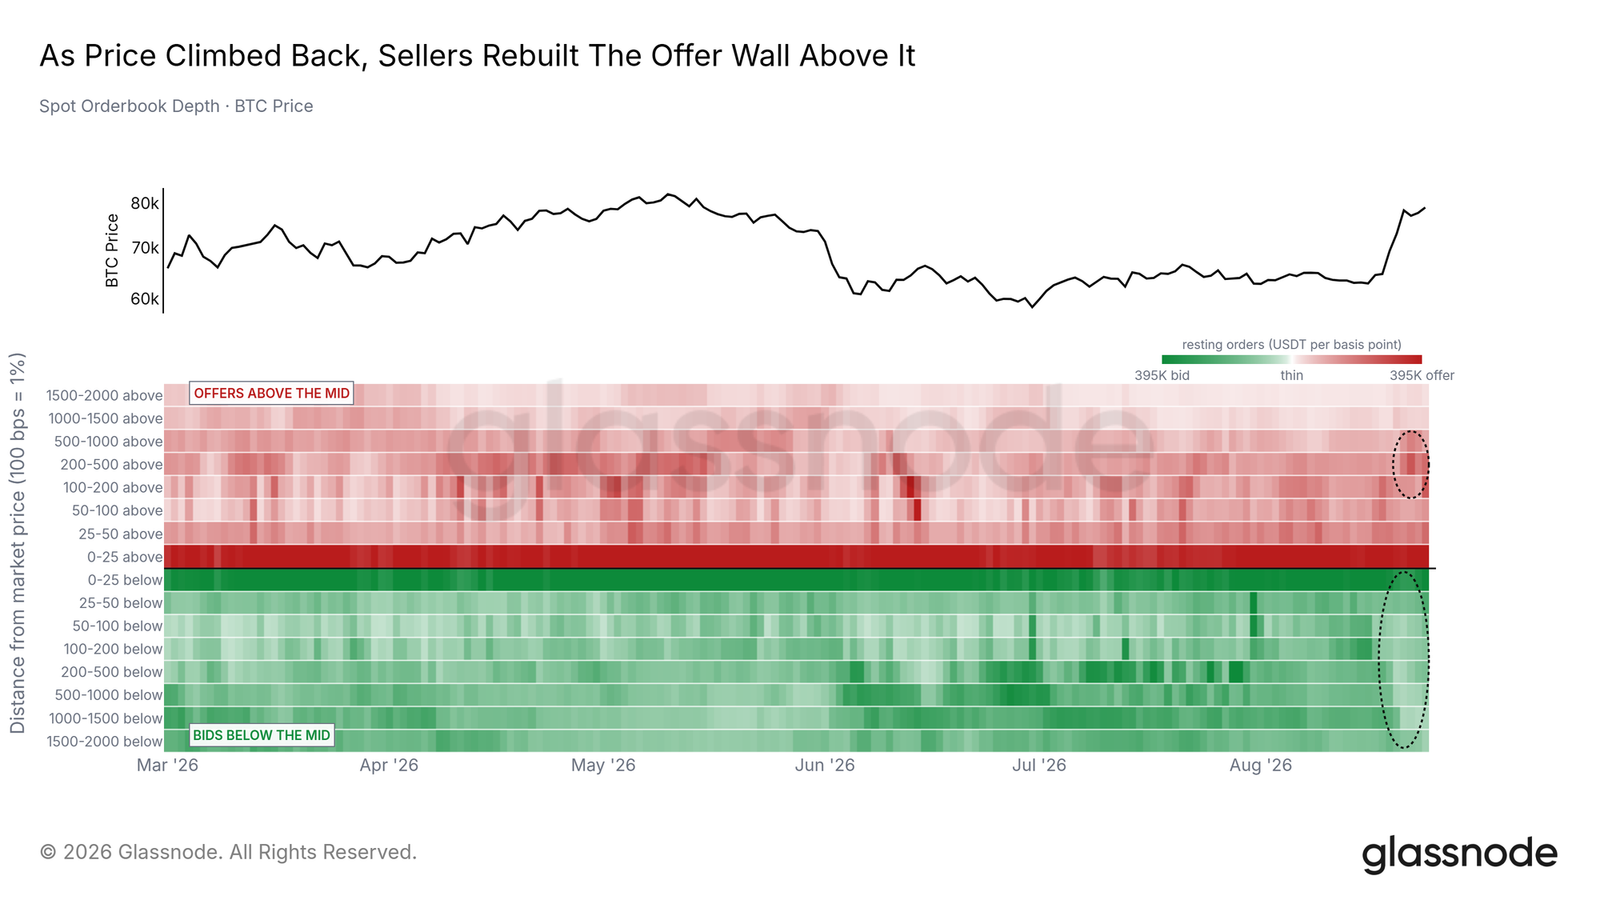
The confluence of sophisticated on-chain analytics from Glassnode and corroborating technical indicators paints a compelling picture: Bitcoin is at a critical juncture. The price band between $81,000 and $86,000 represents a formidable supply wall, composed of long-term holder conviction being tested at breakeven, significant new ask liquidity on exchanges, and a dense cluster of other technical and options-related resistance points.
For Bitcoin to establish a sustained upward trajectory and potentially re-enter a more robust bull market phase, it must demonstrate unequivocally strong demand capable of absorbing this substantial overhead supply. A decisive break above $86,000, accompanied by high trading volume and a flip of these resistance levels into support, would be a powerful bullish signal, potentially clearing the path for further price discovery. Conversely, a rejection from this zone could lead to a period of consolidation, or even a pullback, as the market digests the overwhelming supply. The coming days and weeks will undoubtedly be a true demand test for Bitcoin, revealing the underlying strength and conviction of its buyer base against a thickening wall of liquidity.
This article is produced in accordance with Cointelegraph’s Editorial Policy and is intended for informational purposes only. It does not constitute investment advice or recommendations. All investments and trades carry risk; readers are encouraged to conduct independent research.