XRP (XRP) faces a critical juncture, risking a significant further drop below the psychological $1 threshold as a potent combination of bearish technical indicators converges with an alarming surge in exchange inflows, signaling intensified selling pressure from large holders.
Key Takeaways:
- Overhead Resistance: XRP’s recent rally was decisively rejected at the $1.39-$1.43 range, an area identified by the cost-basis distribution heatmap as a dense cluster of supply, where nearly 1.48 billion XRP were acquired over the last 30 days, creating a formidable overhead resistance zone.
- Symmetrical Triangle Breakdown: The cryptocurrency is currently trading below the lower trendline of a symmetrical triangle pattern that has constrained its price since February 1. A confirmed daily close below this critical support at $1.35 would validate a bearish breakout, projecting a measured target of $0.95 – approximately a 29% decline from current levels.
- Crucial Support Levels: Further downside targets include the falling channel’s lower boundary at $1.20, followed by the February 6 low of $1.11, and the significant psychological support at $1.00. A more severe scenario, highlighted by whale activity on the two-day chart, suggests a potential plunge to $0.80.
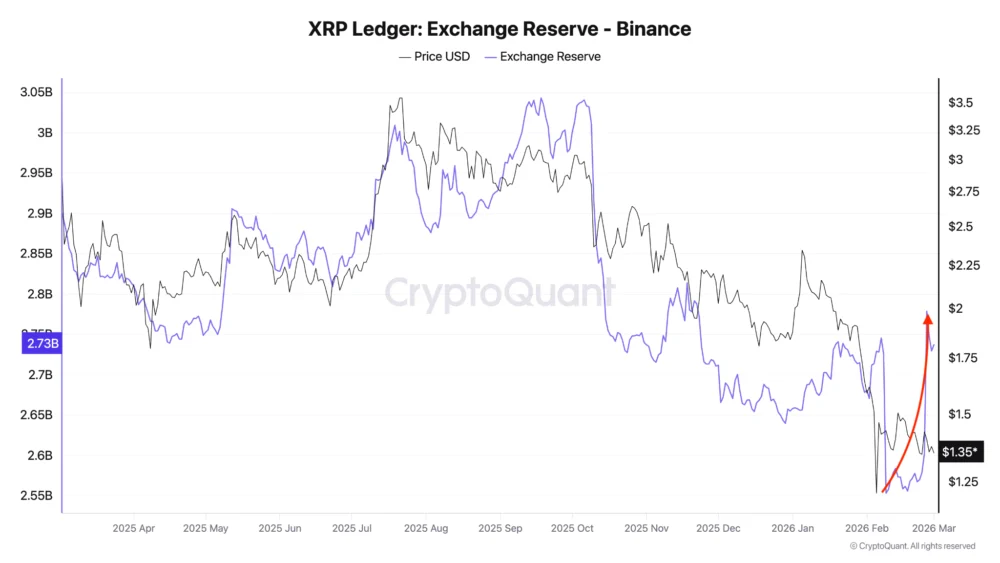
- Escalating Exchange Inflows: Over the past week, a massive 472 million XRP, valued at around $652 million, flowed into exchanges, predominantly Binance. This marks the largest such inflow in February and typically indicates an increased willingness among holders to sell, directly contributing to heightened selling pressure.
- Rising Exchange Reserves: Consequently, XRP reserves on Binance have swelled from 2.55 billion to 2.73 billion tokens in less than three weeks—a 7% increase. This growing supply on exchanges, without a proportional increase in demand, is a classic bearish signal, threatening to overwhelm buying interest and drive prices lower.
XRP’s recent price action has been a rollercoaster, with a 13% rally from Saturday to Sunday pushing its value to $1.43. However, this upward momentum was abruptly halted at the $1.39-$1.43 resistance wall, leading to a swift retracement to the current price of $1.34. This particular price band is not merely a random point of contention; it represents a significant obstacle rooted in the very structure of market psychology and supply dynamics. Data from Glassnode’s cost-basis distribution heatmap vividly illustrates this, revealing a substantial cluster of supply within this area. Specifically, close to 1.48 billion XRP tokens were acquired by investors within this range over the last 30 days. This concentration of recent buyers means that as the price approaches this level, many of these holders, who may have been underwater or are now just breaking even, are likely to offload their holdings, creating immense selling pressure and severely limiting any immediate upside potential for XRP. This phenomenon is a textbook example of "overhead resistance," where previous buyers become potential sellers at their cost basis.
The daily XRP price chart further corroborates this bearish outlook, showing that this critical resistance area precisely coincides with the upper trend line of a symmetrical triangle pattern. This pattern has effectively capped XRP’s price movements since February 1, acting as a ceiling for any rallies. More concerningly, the XRP/USD pair is currently trading precariously below the lower trend line of this very triangle, situated at $1.35. A confirmed daily candlestick close below this pivotal level would serve as a strong validation of a bearish breakdown from the symmetrical triangle. Such a breakdown would effectively clear the path for a much deeper price correction. According to technical analysis principles, the "measured target" of this prevailing chart pattern is calculated by projecting the triangle’s height from the breakout point. In XRP’s case, this target is a sobering $0.95, representing a potential drop of approximately 29% from its current trading level. This isn’t just a minor correction; it signals a significant capitulation if the pattern plays out as expected.

Adding to the layers of technical bearishness, previous Cointelegraph reports have highlighted additional downside risks. A definitive break and close below the lower boundary of a falling channel at $1.20 would put the February 6 low of $1.11 firmly in the crosshairs. Should that level fail to hold, the cryptocurrency could then tumble towards the crucial psychological support level of $1.00. While some analysts maintain a cautious optimism, the overall sentiment is leaning bearish. Analyst BitGuru, for instance, commented on the $1.20-$1.22 support level, stating, "If this base holds and buyers step in, a rebound toward $1.80–$2.20 could happen quickly, signaling the start of a recovery move." However, this scenario heavily relies on buyers stepping in forcefully at a point where broader market indicators are suggesting the opposite. The prevailing momentum indicates that the downside risks are currently more pronounced than the upside potential. Furthermore, a deeper dive into the two-day chart analysis reveals an even more dire projection, putting a drop to $0.80 firmly in play. This particularly pessimistic outlook is fueled by observed selling activity from large holders, commonly referred to as "whales." Whale movements are often significant indicators of market direction, as their substantial holdings can single-handedly influence supply-demand dynamics and market sentiment. When whales begin to offload their tokens, it often precedes or accompanies significant price declines.
Beyond these chart patterns and historical support/resistance levels, a confluence of other technical indicators paints a similarly grim picture. The Relative Strength Index (RSI), a momentum oscillator, on daily and even weekly charts, shows a declining trend, signaling weakening buying pressure and increasing bearish momentum, potentially indicating a move towards oversold territory but not before further price depreciation. The Moving Average Convergence Divergence (MACD) indicator is also flashing bearish signals, with the MACD line crossing below the signal line, suggesting that the short-term average price is falling faster than the long-term average, which is a classic sell signal. Moreover, XRP’s price is trading below key moving averages, such as the 50-day and 200-day Exponential Moving Averages (EMAs), which are typically dynamic resistance levels during downtrends. A "death cross" — where the 50-day EMA crosses below the 200-day EMA — if it occurs, would be a strong long-term bearish confirmation. Volume analysis further supports this outlook; recent price rallies have been accompanied by relatively low trading volumes, indicating a lack of conviction from buyers, while downward movements tend to see higher volumes, confirming selling pressure. Fibonacci retracement levels from previous highs to recent lows also point to potential support zones below current prices, with the 0.618 and 0.786 levels aligning with the projected targets of $0.95 and $0.80, respectively.

Compounding these technical headwinds is a significant and undeniable shift in on-chain data: a substantial increase in XRP supply on exchanges. Over the past week alone, more than 472 million XRP tokens, an astronomical sum valued at approximately $652 million at current prices, have been transferred to various exchanges, with Binance being a primary recipient. This influx marks the largest single inflow to exchanges recorded in February, making it a critical data point for analysts. The transfer of such a massive volume of tokens to exchanges is almost universally interpreted as a precursor to selling. Holders move their assets from cold storage or private wallets to exchanges primarily to facilitate transactions, and in the context of a bearish market, this typically signals an intent to liquidate holdings or at least to position liquidity closer to the market for potential selling. CryptoQuant analyst Darkfost underscored this sentiment in a QuickTake note on Monday, stating, "Such inflows typically reflect a more defensive posture from investors holding XRP." Darkfost further elaborated on the potential impact, adding, "When the amount of flows like this are recorded, they can create the conditions for a sudden wave of selling pressure capable of impacting price action in the short term."
The direct consequence of these inflows is evident in the growing XRP balance on exchanges. Specifically, the XRP reserve on Binance, a leading global exchange, has swelled considerably, rising from 2.55 billion tokens in mid-February to an alarming 2.73 billion tokens currently. This represents a total increase of about 180 million XRP, or a 7% surge, in less than three weeks. This rapid accumulation of supply on exchanges is a classic and potent bearish signal. In fundamental economic terms, when the supply of an asset in the market increases significantly without a corresponding rise in demand, the natural outcome is downward pressure on its price. The sheer volume of XRP now readily available for sale could easily overwhelm any existing buying demand, making it increasingly difficult for the price to recover or even stabilize. This elevated "sell-side liquidity" means that any minor buying pressure can be quickly absorbed by sellers, preventing upward movement and making deeper price corrections more probable.

Further on-chain analysis reinforces this grim outlook. The netflow of XRP to exchanges, which measures the difference between inflows and outflows, has been consistently positive, indicating a continuous net transfer of tokens onto trading platforms. This persistent positive netflow suggests that the trend of increasing sell-side pressure is not a one-off event but an ongoing dynamic. Moreover, a deeper look at whale transactions—those involving exceptionally large amounts of XRP—shows a distinct pattern of distribution rather than accumulation. These large holders, who often possess superior market insights or information, appear to be strategically reducing their exposure, which historically correlates with impending price drops. In the derivatives market, the situation appears equally cautious. While not explicitly detailed in the original report, an increase in short positions in XRP futures contracts and potentially negative funding rates on perpetual swaps would further indicate a bearish sentiment among sophisticated traders. A decline in active addresses, signaling waning retail interest, and a drop in transaction volume (excluding the large exchange transfers) would also confirm a lack of organic demand to counteract the increasing supply.
Considering the broader cryptocurrency market context, XRP’s potential downturn is not entirely isolated. While the article focuses on XRP-specific metrics, the general market sentiment often plays a significant role. If major cryptocurrencies like Bitcoin and Ethereum are experiencing volatility or a downturn, altcoins like XRP are typically more susceptible to exaggerated price movements. Macroeconomic factors, such as global inflation rates, central bank interest rate policies, and overall liquidity in the financial markets, also exert a profound influence on risk assets like cryptocurrencies. A tightening of monetary policy or increased economic uncertainty could further exacerbate the bearish pressure on XRP. Lastly, while the specific legal battle between Ripple and the SEC is not the primary focus of this article’s technical and on-chain analysis, its historical impact on XRP’s volatility and investor confidence cannot be entirely discounted. Lingering uncertainties, even if diminished, can contribute to a cautious investor posture, making large holders more prone to take profits or cut losses when opportunities arise.

In conclusion, XRP stands at a precarious crossroads. The confluence of strong overhead resistance, a validated symmetrical triangle breakdown pointing to $0.95, and critically, an escalating supply of XRP on exchanges driven by significant inflows, paints a decidedly bearish picture. While the $1.20-$1.22 and $1.00 levels offer some hope for support, the overwhelming technical and on-chain evidence suggests that XRP faces substantial downside risk. The potential for a 30% drop to $0.95, or even further to $0.80 if whale selling intensifies, is a serious concern for investors. The increasing readiness of holders to sell, as indicated by surging exchange reserves, places XRP in a vulnerable position where demand may struggle to keep pace with the available supply. Investors are strongly advised to exercise extreme caution and conduct thorough due diligence, as the path of least resistance for XRP appears to be downwards in the immediate future.
This article does not contain investment advice or recommendations. Every investment and trading move involves risk, and readers should conduct their own research when making a decision. While we strive to provide accurate and timely information, Cointelegraph does not guarantee the accuracy, completeness, or reliability of any information in this article. This article may contain forward-looking statements that are subject to risks and uncertainties. Cointelegraph will not be liable for any loss or damage arising from your reliance on this information.