Key points:

- Hot PPI Print: January’s Producer Price Index (PPI) exceeded forecasts, indicating persistent inflationary pressures.
- Fed Rate Cut Expectations: The likelihood of a March rate cut plummeted, raising concerns about tighter monetary conditions for longer.
- Bitcoin’s Downturn: BTC experienced a notable daily decline, nearing 2.5% on Bitstamp, reflecting increased risk aversion.
- Safe Haven Outperformance: Gold and silver surged, hitting multi-week highs as investors sought refuge from inflation fears.
- Monthly Close Jitters: Analysts warn of potential significant downside for Bitcoin as it faces its fifth consecutive month of losses, a streak not seen since 2018.
Bitcoin found itself under renewed pressure after the release of the latest US Producer Price Index (PPI) figures, which came in hotter than anticipated. Data from TradingView showed the daily BTC price downside nearing 2.5% on Bitstamp, pushing the cryptocurrency further into a correctional phase. This decline contrasted sharply with the performance of traditional safe havens, as gold eyed its highest levels since late January, crossing the $5,200 per ounce mark, and silver revisited $92, hitting its highest point since January 30. The divergence underscored a clear shift in investor sentiment, with capital flowing away from risk assets towards perceived stores of value in the face of inflationary concerns.
The January print of the Producer Price Index (PPI), a crucial indicator that measures the average change over time in the selling prices received by domestic producers for their output, came in markedly above expectations. The Bureau of Labor Statistics (BLS) reported a 0.5% month-over-month increase in final demand prices, significantly higher than the anticipated 0.3%. Even more concerning was the Core PPI, which excludes volatile food and energy prices, soaring by 0.8% month-over-month against a consensus forecast of just 0.3%. This substantial overshoot signaled that inflationary pressures remain embedded within the economy, particularly on the supply side, which often precedes consumer price increases.

The BLS statement accompanying the data provided further insight, noting: “The January increase in prices for final demand can be traced to a 0.8-percent advance in the index for final demand services. In contrast, prices for final demand goods declined 0.3 percent.” This breakdown highlights a key challenge for policymakers: sticky services inflation. While goods prices, which were a major driver of inflation during the pandemic, are showing signs of cooling, the cost of services continues to rise. This persistent services inflation is often linked to wage growth and robust consumer demand, making it particularly difficult for the Federal Reserve to bring overall inflation down to its 2% target.
The immediate consequence of this "hot" PPI print was a significant reassessment of the Federal Reserve’s future monetary policy. Prior to the data release, markets had been cautiously optimistic about the prospect of interest rate cuts commencing as early as March. However, with US inflation creeping higher more quickly than markets assumed, the probability of such a move diminished dramatically. According to the latest readings from CME Group’s FedWatch Tool, expectations for an interest-rate cut by the Federal Reserve at its March meeting fell below a meager 4%. This stark reduction in probability reflects the market’s understanding that the Fed, committed to its dual mandate of maximum employment and price stability, will likely maintain its restrictive monetary stance for longer to ensure inflation is definitively brought under control. Higher interest rates typically make non-yielding assets like Bitcoin less attractive compared to traditional interest-bearing investments, contributing to downward pressure on its price.

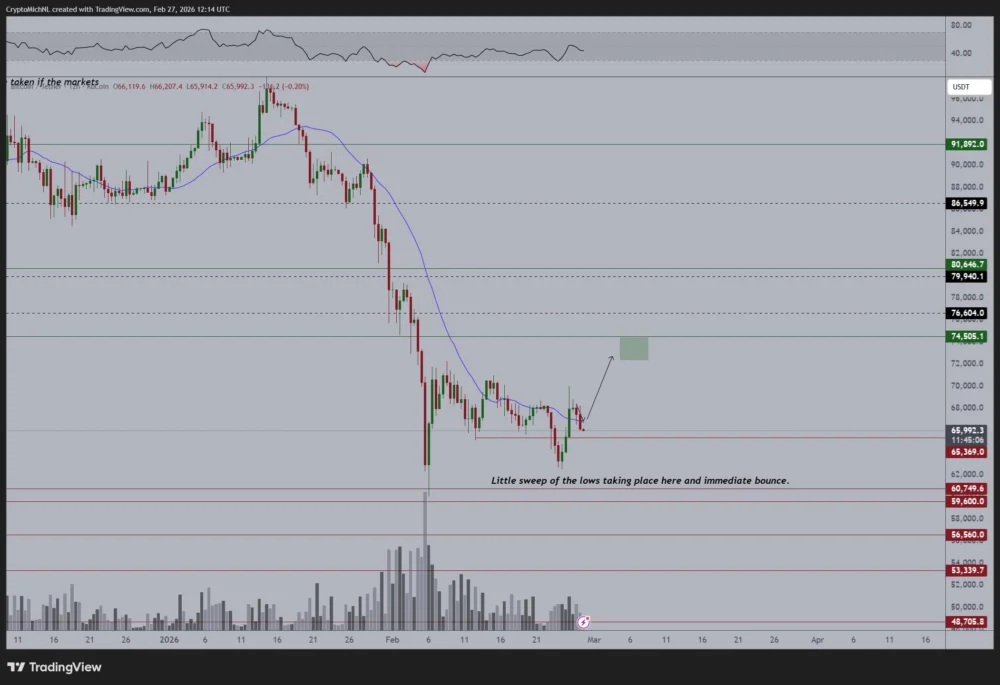
Beyond the immediate price action, Bitcoin market participants remained on edge, particularly with the monthly close in focus. The end of a trading month often brings increased volatility as institutional investors rebalance portfolios and technical indicators reset. Crypto trader, analyst, and entrepreneur Michaël van de Poppe warned of a possible rerun of events from early February, where BTC/USD put in significant lows near $59,000. In his latest analysis on X, he articulated the precarious position: “Pretty crucial area for me to hold on to. I’d highly favor that $BTC finds a higher low at $65k.” However, he added a cautionary note that resonated deeply with market sentiment: “However, last day of the month; remember last month? A massive collapse on the markets. Let’s see what it brings: holding $65K opens up the scenario to run up from here.” This sentiment underscores the anxiety surrounding Bitcoin’s ability to maintain critical support levels in the face of mounting macroeconomic headwinds. The $65,000 level is considered a significant psychological and technical support, and a failure to hold it could trigger further sell-offs, potentially targeting lower price points.
Earlier, Cointelegraph had reported on key resistance levels that bulls needed to reclaim to reverse the bearish trend. These included the 200-week exponential moving average (EMA) and the old all-time highs around $69,000. The 200-week EMA is a widely watched long-term trend indicator, and trading below it often signals a bearish market structure. Reclaiming old all-time highs, meanwhile, would signify a strong return of bullish momentum and a potential move into price discovery. However, the current macroeconomic climate, exacerbated by the latest PPI data, makes such a reclaim increasingly challenging.

At the time of writing, BTC/USD’s performance roughly matched February 2025 in terms of its monthly trajectory, with losses nearing 17% month-to-date. More strikingly, the pair prepared its fifth consecutive month of losses, a phenomenon absent from the charts since 2018, as confirmed by data from CoinGlass. This extended period of declines is a significant historical anomaly for Bitcoin, which is known for its volatile but generally upward long-term trend. A five-month losing streak suggests a deeper underlying weakness or a prolonged period of consolidation, potentially driven by a combination of macroeconomic factors, regulatory uncertainties, and a natural cooling off after periods of rapid growth. The implications of such a streak could dampen investor confidence and signal a more protracted bear market or accumulation phase.
The confluence of higher-than-expected inflation, a hawkish Federal Reserve, and a technically fragile Bitcoin market creates a challenging environment for cryptocurrency investors. While Bitcoin’s long-term proponents often point to its scarcity, decentralization, and potential as a hedge against fiat inflation, its current sensitivity to traditional economic indicators suggests it is still largely viewed as a risk asset. The coming weeks will be crucial as markets digest the full implications of the PPI data and look for clearer signals from the Federal Reserve regarding its path forward. Any further indication of persistent inflation or delayed rate cuts could continue to weigh heavily on Bitcoin and the broader cryptocurrency ecosystem, testing the resolve of even the most ardent bulls as the monthly close looms large.

This article does not contain investment advice or recommendations. Every investment and trading move involves risk, and readers should conduct their own research when making a decision. While we strive to provide accurate and timely information, Cointelegraph does not guarantee the accuracy, completeness, or reliability of any information in this article. This article may contain forward-looking statements that are subject to risks and uncertainties. Cointelegraph will not be liable for any loss or damage arising from your reliance on this information.