BTC Double-Bottom Pattern Hints at Trend Reversal: The Adam and Eve Formation
One of the most compelling signals currently under scrutiny by technical analysts is the formation of an "Adam and Eve bottom" pattern on Bitcoin’s 12-hour chart. This pattern, a sophisticated variation of the classic double-bottom reversal, is widely regarded as a strong harbinger of a shift from a prevailing downtrend to an nascent uptrend. Following a challenging period where Bitcoin touched a multi-year low of $60,000 on February 6, the cryptocurrency demonstrated remarkable resilience, recovering a notable 21% to reach a 30-day high of $74,000. While it subsequently experienced a minor retracement to $72,500 on Thursday, the underlying structure of the price action points towards a deeper reversal.

Crypto analyst Jelle, a prominent voice in the digital asset space, highlighted that the "Adam and Eve bottom is still playing out." This pattern is characterized by two distinct troughs: the "Adam" bottom, typically sharp and V-shaped, representing a swift and aggressive sell-off followed by an equally sharp rebound; and the "Eve" bottom, which is more rounded and gradual, indicating a period of consolidation and accumulation as selling pressure dissipates and buyers slowly gain control. The distinction between the sharp "Adam" and the rounded "Eve" provides a visual representation of market sentiment transitioning from panic to cautious optimism.
The pattern achieved a critical confirmation when Bitcoin’s price successfully broke out and closed above its "neckline" — the peak that separates the two bottoms — at the $70,000 mark on Wednesday. This decisive move above the neckline is a textbook signal for the Adam and Eve pattern, indicating that the bearish momentum has likely exhausted itself and bullish forces are taking over. However, Jelle cautioned that for the pattern to truly sustain its bullish implications, "The bulls must hold the breakout area, or are we going for another nasty deviation before lower." This emphasizes the importance of the $70,000 level transforming from a resistance point into a foundational support zone, preventing any further significant downside. Previously, reports from Cointelegraph underscored that a deceleration in profit-taking activities was a necessary precursor for BTC to firmly hold the $70,000 level and solidify the recovery, a condition that now appears to be manifesting.
Bitcoin-Gold Chart Flashes Another Bottom Signal: A Shift in Risk Appetite

Beyond traditional chart patterns, the relative performance of Bitcoin against gold offers another potent signal of a potential market bottom. As of March, Bitcoin’s price, when benchmarked against the traditional safe-haven asset gold, has been entrenched in a downtrend for 13 consecutive months, a period initiated after its peak in December 2024. This extended period of underperformance against gold carries significant implications.
When Bitcoin’s value depreciates relative to gold, it typically signals a broad "risk-off" sentiment pervading financial markets. In such environments, investors tend to reduce their exposure to riskier assets like Bitcoin, opting instead for perceived safer havens such as gold. This shift in capital allocation often reflects growing fears of macroeconomic instability, heightened geopolitical uncertainties, or a broader liquidity squeeze across global markets. Gold, with its long-standing history as a store of value, traditionally benefits during these periods of market apprehension.
Nic, CEO of Coinbureau, highlighted a compelling historical parallel in a recent post on X, stating, "In the 3 previous cycles, it’s taken about 14 months to go from peak to bottom." He further added, "These also coincided with bear market bottoms." This observation suggests a cyclical pattern where Bitcoin’s prolonged underperformance against gold historically aligns with major market troughs.

The most recent instance of this pattern occurred in late 2022. As the Bitcoin-gold ratio bottomed out, the price of BTC also hit a significant macro low of $15,500. What followed was a spectacular surge, with Bitcoin climbing an astounding 352% to reach its previous all-time high of $73,800 in March 2024. Similar dynamics were observed in 2018 and 2014, where Bitcoin experienced substantial gains, ranging between 300% and 450%, approximately a year after the BTC/XAU pair registered its lowest point. Given that the current drawdown from the last ratio peak has now extended for 13 months, this historical precedent strongly suggests that a bottom in Bitcoin’s price may be imminent, signaling a potential resurgence in risk appetite among investors.
Bitcoin’s Ascending Channel Hints at a Cycle Bottom: Multi-Year Support
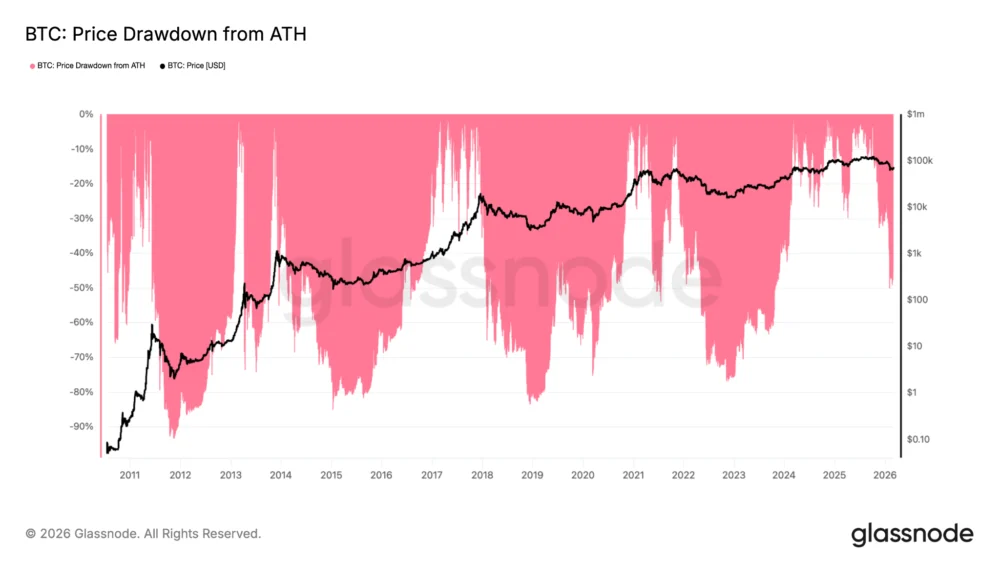
Zooming out to a broader perspective, data from TradingView reveals another powerful indicator: Bitcoin’s price is currently retesting a critical multi-year support trend line on the monthly time frame. This long-term trend line, which forms the lower boundary of an ascending channel, has historically proven to be an incredibly reliable marker for bear market bottoms in Bitcoin’s history.

Analysis of past cycles shows that this trend line effectively cushioned severe downturns in both 2018 and 2022, providing the necessary support for the cryptocurrency to rebound and initiate new bull cycles. Trader and analyst Coinvo Trading elaborated on this pattern in a video post on X, stating, "Bitcoin is now approaching the historical bottom level at the trend line." The significance of this retest cannot be overstated; touching such a well-established, multi-year support often precedes a significant reversal. Coinvo Trading further added, "If history plays out, Bitcoin is going to retest this trend line and then top out somewhere around $500K." While such a target appears ambitious, it underscores the potential upside that historically follows a successful retest of this foundational support, reflecting the inherent long-term bullish bias of Bitcoin within this ascending channel. This pattern suggests that despite the recent crash, Bitcoin remains within a larger, upward-sloping trajectory that has defined its growth over multiple cycles.
Weekly Chart Reinforces Bottoming Narrative: A Confluence of Signals
Complementing the monthly analysis, fellow analyst Rekt Fencer observed a similar, equally compelling pattern on Bitcoin’s weekly time frame. He expressed strong conviction, stating that he was "sure the BTC bottom is in" after identifying a trend line retest that mirrors the one seen on the monthly chart. This weekly trend line also notably marked the 2022 bottom, providing a more granular confirmation of the broader monthly signal. The alignment of these signals across different timeframes – from the detailed 12-hour Adam and Eve pattern to the multi-year monthly and weekly trend line retests – creates a powerful confluence of evidence.

This layering of technical indicators strengthens the argument for an imminent bottom. As Cointelegraph previously reported, several technical indicators have been pointing towards Bitcoin nearing a potential bottom, including the Relative Strength Index (RSI). The RSI, a momentum oscillator that measures the speed and change of price movements, often signals oversold conditions when it drops to certain levels, indicating that a reversal may be on the horizon. When such indicators align with clear price action patterns like the double-bottom and retests of long-term support, it significantly increases the probability of a market turning point.
In conclusion, while Bitcoin has endured a substantial decline from its peak, the collective message from these four critical charts is one of cautious optimism. The confirmation of an Adam and Eve double-bottom pattern, the historical reliability of the Bitcoin-gold ratio’s bottoming signals, and the retest of multi-year ascending channel support lines on both monthly and weekly charts, all converge to suggest that the $60,000 to $72,000 range is solidifying as a crucial floor. These technical setups, alongside other momentum indicators, provide compelling evidence that Bitcoin is not just finding support, but actively preparing for a potential sustained recovery, potentially marking the end of the current correction phase and the dawn of a new bullish cycle. Investors and enthusiasts alike will be watching closely to see if history, once again, rhymes with these powerful chart patterns.
This article does not contain investment advice or recommendations. Every investment and trading move involves risk, and readers should conduct their own research when making a decision. While we strive to provide accurate and timely information, Cointelegraph does not guarantee the accuracy, completeness, or reliability of any information in this article. This article may contain forward-looking statements that are subject to risks and uncertainties. Cointelegraph will not be liable for any loss or damage arising from your reliance on this information.