Bitcoin’s sharp decline of approximately 7% to $77,000 on a recent Saturday has sparked significant debate across the cryptocurrency landscape, with prominent analyst PlanC suggesting this might represent the cycle’s definitive low, even as other market observers caution against premature optimism and predict further downside.
The crypto market, known for its inherent volatility, experienced a dramatic weekend correction that saw Bitcoin (BTC) shed thousands from its value, triggering anxieties among investors but also igniting hopes of a potential bottom. PlanC, a respected voice in the Bitcoin analytical community, quickly took to X (formerly Twitter) to share his insights, stating, "Decent chance this will be the deepest pullback opportunity this Bitcoin bull run." This bold assertion, made via an X post on Saturday, immediately set a tone of cautious optimism amidst widespread uncertainty. The analyst’s perspective stands in stark contrast to a segment of the market that continues to anticipate deeper corrections for Bitcoin in the months ahead, highlighting the divergent views that characterize this dynamic asset class.
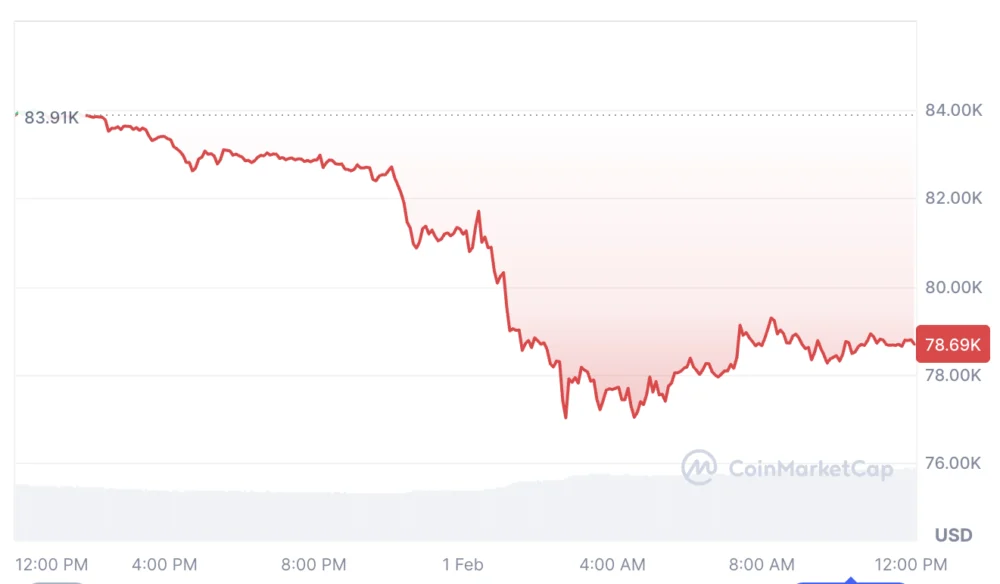
According to CoinMarketCap data, Bitcoin’s price briefly touched $77,000 before a modest rebound, settling around $78,690 at the time of publication. This dip pushed Bitcoin’s value down by roughly 38% from its all-time high of $126,100, which it achieved on October 5th. Such a substantial correction is not unfamiliar territory for Bitcoin, and PlanC’s analysis draws heavily on historical parallels, comparing the recent downturn to some of the most challenging periods in Bitcoin’s past. He specifically referenced the harrowing 2018 bear market capitulation, which saw Bitcoin plunge to approximately $3,000, the "Black Thursday" crash of March 2020 where the asset fell to around $5,100 amid global economic panic, and the dramatic collapse of the FTX exchange, which triggered a decline to roughly $15,500. Each of these events represented significant "capitulation lows," characterized by widespread panic selling, forced liquidations, and a general loss of confidence, often preceding a prolonged period of accumulation and eventual recovery.
"There is a decent chance we are going through another major capitulation low as we speak," PlanC reiterated, emphasizing the psychological and market structure similarities between the current situation and these historical precedents. He further elaborated on his conviction, suggesting that "It seems like the ultimate low will be between $75,000 and $80,000," thereby providing a specific range for what he believes could be the cycle’s floor. This type of historical pattern recognition is a cornerstone of many technical and on-chain analyses in the crypto space, where past market cycles often offer valuable, albeit imperfect, insights into future movements. The idea is that human psychology and market mechanics tend to repeat, especially during periods of extreme fear.
The weekend’s price action also prompted commentary from other prominent figures. Rajat Soni, a respected Bitcoin advocate and financial accountant, weighed in on the sudden drop. In an X post on Saturday, Soni cautioned traders against overreacting to weekend price movements, noting that crypto markets often exhibit heightened volatility during these periods due to thinner liquidity and different trading patterns. "Never trust a weekend pump OR dump," Soni advised, highlighting the tendency for price swings during Saturday and Sunday to be less indicative of fundamental market shifts. He added a reassuring note, stating, "Bitcoin will make a comeback when you least expect it," a sentiment often echoed by long-term holders who advocate for patience during market downturns. Weekend trading often sees a reduced presence of institutional players, leaving the market more susceptible to retail-driven movements and cascading liquidations, which can exaggerate price swings.
However, PlanC’s optimistic outlook is not universally shared. A significant portion of the analytical community continues to forecast further downside for Bitcoin. Veteran trader Peter Brandt, renowned for his classical charting principles and accurate predictions, recently presented a more bearish scenario. Brandt predicted that Bitcoin could potentially fall as low as $60,000 by the third quarter of 2026. His analysis often involves identifying classical chart patterns like head-and-shoulders, descending triangles, or double tops, and projecting potential price targets based on these formations. While the exact methodology for his $60,000 target was not detailed in the original report, Brandt’s track record lends weight to his predictions, urging investors to consider a wider range of possibilities beyond an immediate bottom.

Similarly, crypto analyst Benjamin Cowen, known for his in-depth market cycle analyses and logarithmic regression models, has also pointed to a more extended period of correction. Cowen suggested that Bitcoin’s market cycle low is more likely to occur in early October, implying that the current $77,000 level may only be a temporary pause in a broader downtrend. However, he offered a glimmer of hope for traders, stating that he "anticipates plenty of rallies will occur between now and then," suggesting a choppy, volatile period rather than a straight line down. Cowen’s models often look at Bitcoin’s performance relative to its historical growth curves, identifying periods where price deviates significantly from its long-term trend, which he then uses to predict potential bottoms and tops.
Further reinforcing the cautious sentiment, Jurrien Timmer, Fidelity’s director of global macroeconomic research, provided a macro-oriented perspective. Timmer suggested that 2026 could be a "year off" for Bitcoin, indicating a period of stagnation or further decline, with prices potentially falling to as low as $65,000. Timmer’s analysis typically integrates broader economic indicators, such as inflation rates, interest rate policies from central banks, and global liquidity trends, with Bitcoin’s supply-demand dynamics. His outlook often frames Bitcoin within the context of traditional financial markets, suggesting that a tightening global monetary environment could exert downward pressure on risk assets like cryptocurrencies.
Beyond the immediate price action and analyst predictions, several underlying factors contribute to Bitcoin’s current volatility and the uncertainty surrounding its future trajectory. Macroeconomic headwinds, including persistent inflation concerns, the Federal Reserve’s stance on interest rates, and geopolitical tensions, often ripple through traditional markets and influence risk assets like Bitcoin. Institutional flows, particularly through the recently launched spot Bitcoin ETFs, also play a crucial role. While these ETFs have brought unprecedented institutional capital into the market, they also introduce a new layer of complexity, as large-scale inflows or outflows can significantly impact price.
On-chain metrics, often touted as a more transparent view into Bitcoin’s health, offer mixed signals. Indicators like the MVRV ratio (Market Value to Realized Value), which compares market capitalization to the average price at which coins were acquired, can signal whether Bitcoin is overbought or oversold. A low MVRV ratio often suggests a market bottom. Similarly, the SOPR (Spent Output Profit Ratio) indicates whether coins being moved on-chain are, on average, being sold at a profit or loss. A SOPR below 1, especially after a significant drop, can suggest capitulation. HODL waves, which illustrate the age distribution of Bitcoin holdings, can show whether long-term holders are accumulating or distributing their coins. During capitulation phases, older coins might move, indicating some long-term holders giving up. Conversely, strong accumulation by long-term holders after a dip often precedes a recovery. While the specific data for the $77,000 dip isn’t fully detailed in the original article, a comprehensive analysis would delve into these metrics to either support or challenge PlanC’s "decent chance" thesis.
Technical analysis also points to critical support and resistance levels around the $77,000 mark. Moving averages, such as the 50-day and 200-day simple or exponential moving averages, often act as dynamic support or resistance. A break below key moving averages can signal further bearish momentum, while reclaiming them can indicate a reversal. Fibonacci retracement levels from the all-time high to previous significant lows could also identify potential bounce zones or further downside targets. The Relative Strength Index (RSI) and Moving Average Convergence Divergence (MACD) oscillators provide insights into momentum and potential trend reversals, with oversold readings often coinciding with local bottoms.
The recent Bitcoin halving event, which reduces the supply of new Bitcoin entering the market, traditionally acts as a bullish catalyst over the long term. However, its immediate impact is often muted, with price appreciation typically occurring several months to a year after the event. The current price action, occurring post-halving, aligns with historical patterns of initial consolidation or even further correction before a more sustained bull run takes hold. Miners, who have just seen their block rewards halved, may face increased pressure to sell some of their Bitcoin holdings to cover operational costs, potentially adding to sell-side pressure in the short term.
In conclusion, while PlanC’s assessment of a "decent chance" that Bitcoin has already bottomed at $77,000 offers a glimmer of hope for investors, the broader market sentiment remains divided. The historical parallels he draws are compelling, reminding market participants of Bitcoin’s resilience after severe downturns. However, the cautionary notes from analysts like Peter Brandt, Benjamin Cowen, and Jurrien Timmer, coupled with the complex interplay of macroeconomic factors, institutional flows, and on-chain dynamics, suggest that the path forward for Bitcoin is likely to be anything but straightforward. Whether $77,000 indeed marks the cycle’s deepest pullback remains to be seen, but the ongoing debate underscores the inherent uncertainty and opportunity that define the volatile world of cryptocurrency. Investors are encouraged to conduct their own thorough research and consider a diversified approach given the conflicting expert opinions and the market’s unpredictable nature.