Bitcoin (BTC) recently experienced a modest rebound, trading as high as $76,900 on Wednesday, marking a 4.5% surge above its 15-month low of $72,860, which was established on Tuesday. While this brief uptick might offer a glimmer of hope to some investors, a growing chorus of technical analysts and on-chain data indicators are signaling that this respite may be fleeting. Instead, there are increasing signs pointing to a potentially deeper and more prolonged price correction for Bitcoin over the coming weeks or months, suggesting that the current downtrend is far from over.
Key Technical Indicators Point to Significant Downside
The overarching bearish sentiment is heavily influenced by several critical technical patterns observed on Bitcoin’s price charts. Foremost among these is the confirmation of a head-and-shoulders (H&S) pattern on the weekly BTC/USD chart, a classic and highly reliable bearish reversal formation that warns of substantial corrections ahead.

A head-and-shoulders pattern typically comprises three peaks: a left shoulder, followed by a higher central peak (the head), and then a lower right shoulder. A "neckline" connects the lowest points reached between these peaks. In Bitcoin’s case, the price definitively broke below the neckline of this ominous H&S pattern at the $82,000 level on Saturday. This breach is a crucial trigger, signaling the continuation of the downward trend. The measured target for this H&S pattern, derived from its structure, is a staggering $52,650. Should Bitcoin reach this target, it would represent a precipitous 31% loss from the current price levels and a painful 58% drawdown from its all-time high of $126,000. Such a move would liquidate countless long positions and could trigger widespread panic in the market.
Crypto analyst BitcoinHabebe underscored the inevitability of this decline, stating on X that Bitcoin’s drop toward the H&S pattern’s target at $60,000 was "obvious." This analyst attributed the strong bearish momentum to a myriad of macroeconomic headwinds that continue to plague global financial markets, including persistent inflation concerns, rising interest rates, and geopolitical instability, all of which tend to push investors away from riskier assets like cryptocurrencies.
Other analysts have painted an even grimmer picture. Analyst 0xLanister, in a Wednesday post on X, described the H&S setup as a "very scary picture," warning that "Bitcoin price will drop to $40,000." This more aggressive target highlights the extreme levels of fear and uncertainty pervading the market, as traders brace for potentially severe downside movements. The divergence in these targets, ranging from $60,000 to $40,000, underscores the significant bearish pressure but also indicates the uncertainty surrounding the precise bottom of this potential correction.
Adding to the technical woes, traders have also spotted the confirmation of a bear flag pattern on the daily price chart. A bear flag is a continuation pattern that forms during a downtrend, typically signaling that the preceding downtrend will resume once the flag completes. It usually consists of a sharp, downward move (the flagpole) followed by a short period of consolidation, forming a small, upward-sloping channel (the flag). The confirmation of this pattern occurred after key support levels failed to hold, particularly the crucial $78,000 mark.

Analyst Merlijn Trader echoed this sentiment in a recent X post, declaring, "Bear flag confirmed on Bitcoin," immediately after the last support at $78,000 capitulated. Merlijn Trader further added a crucial insight: "Next liquidity magnet is $65,500." A "liquidity magnet" refers to a price level where a significant concentration of buy or sell orders (often stop-loss orders or pending limit orders) is expected to reside. In this context, $65,500 is anticipated to be a level that attracts substantial trading activity, likely acting as a temporary floor or a point where sellers will exhaust their supply, or where new buyers might step in, at least temporarily. This level could be a critical juncture, potentially offering a short-term bounce before further downward exploration, or a strong support that, if broken, would accelerate the fall. As previously reported by Cointelegraph, Bitcoin faces the risk of continuing its downtrend to as low as $58,000, with few immediate catalysts appearing on the horizon to reverse this prevailing bearish trend.
On-Chain Metrics Reinforce Bearish Outlook
Beyond technical chart patterns, several on-chain metrics are also sounding alarms, suggesting that Bitcoin’s current "accumulation" phase is indicative of sustained bearish pressure rather than an imminent reversal. The Puell Multiple, a metric that tracks miners’ daily revenue against its annual average, has extended its decline deep into the "discount zone." This typically signifies that miners’ profitability is low, often occurring during periods of market capitulation or prolonged bearish trends. The metric’s dive into this zone followed Bitcoin’s latest drop to 15-month lows below $73,000.
CryptoQuant analyst Gaah, in a QuickTake analysis on Tuesday, highlighted that "The indicator has been in this range for at least three months, since November 2025." Gaah further elaborated on the historical context, noting that the average period the Puell Multiple remains in the discount zone is approximately 200 days. Crucially, Gaah observed, "We are halfway through the period, indicating a continuation of the bearish trend in price BTC." This analysis suggests that the market may still have several months of downward pressure or consolidation ahead before a significant recovery can be expected.

Lower Bitcoin prices inherently translate to reduced revenues for miners, placing immense financial strain on their operations. This scenario, according to Gaah, could be the "perfect fuel for small entrepreneurs in the sector to shut down machines and capitulate to cover expenses." Miner capitulation, characterized by smaller, less efficient miners being forced to cease operations due to unprofitability, is historically a strong indicator of a market bottom. However, the current data suggests we are still in the midst of this capitulation phase, implying that the bottom has not yet been definitively reached.
This pressure is further evidenced by the continuous decline in miner reserves. These reserves, representing the amount of BTC held by mining entities, have been steadily decreasing over the last four years, currently standing at 1.8 million BTC at the time of writing. A consistent reduction in miner reserves indicates that miners are increasingly selling their newly minted or existing Bitcoin holdings to cover operational costs, particularly as profitability dwindles. Gaah emphasized, "If price continues to decline, this effect intensifies, increasing pressure to sell miners’ reserves," creating a vicious cycle of selling pressure.
Moreover, Bitcoin’s total network hash rate, a measure of the total computational power dedicated to mining and securing the network, has dropped a significant 12% since its November 2025 highs. This represents the largest decline in the hash rate since 2021, a period also marked by substantial market corrections. A notable drop in hash rate suggests that a considerable number of mining machines have been taken offline, which directly points to ongoing miner capitulation. When mining becomes unprofitable at current prices, miners with higher operational costs or older, less efficient hardware are forced to shut down, reducing the network’s overall hash rate. This decline is a tangible sign of distress within the mining industry, further corroborating the bearish outlook.
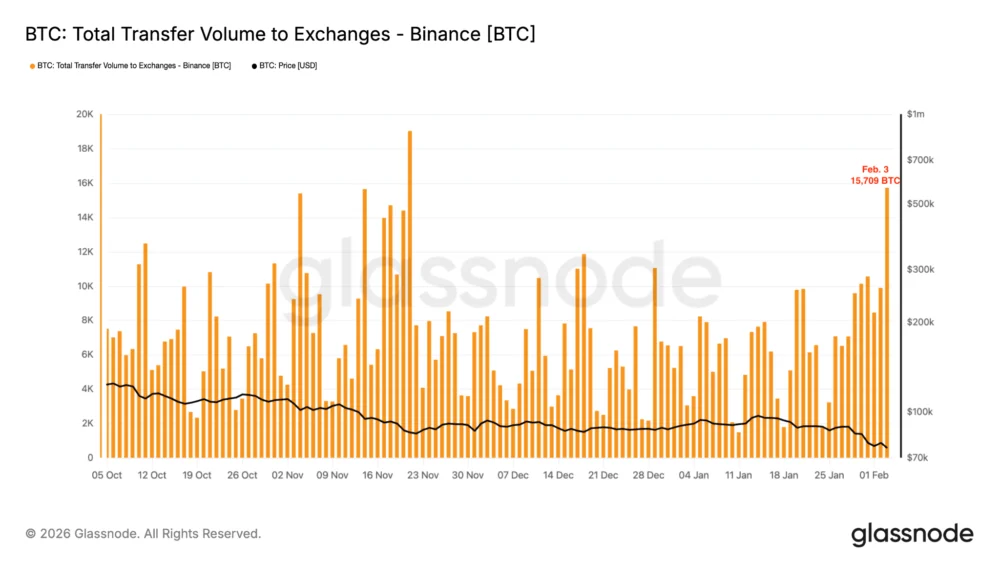
Large Binance Inflows Signal Mounting Selling Pressure

Adding another layer of concern for Bitcoin bulls is the dramatic surge in BTC inflows to the Binance exchange. On Tuesday, daily BTC inflows to Binance reached an alarming 15,709, marking the highest reading since November 21, 2025, according to on-chain data. Historically, similar peaks in exchange inflows have often preceded sharp downward movements in Bitcoin’s price, as large quantities of Bitcoin being moved to exchanges typically indicate an intent to sell.
This recent surge strongly suggests that a significant number of holders are actively preparing to de-risk their portfolios or, more severely, capitulate entirely in response to Bitcoin’s breach of critical support levels. When large amounts of Bitcoin are deposited onto exchanges, it increases the available supply for sale, exerting downward pressure on price unless there is commensurate buying demand.
CryptoQuant analyst Darkfost articulated this concern in a Wednesday post on X, stating, "BTC inflows trigger FUD as selling pressure builds on Binance." Darkfost specifically highlighted the high volume of Bitcoin transfers to the exchange on both Monday and Tuesday, noting, "Over those two days, between 56,000 and 59,000 BTC were sent to Binance, representing a real selling pressure on the spot market." This substantial influx of Bitcoin into exchange wallets points to a collective move by holders to offload their assets, driven by fear and a desire to minimize further losses.
While such capitulation phases can sometimes precede the formation of a market bottom, Darkfost cautioned, "This suggests that we are entering a phase of capitulation and panic as BTC becomes oversold, a context that has historically often allowed for the formation of a bottom, both in the short term and over longer horizons." The key takeaway here is that while the market may be approaching an "oversold" condition that could eventually lead to a bottom, it is currently characterized by intense selling pressure and panic.

With the market struggling to secure support above the $74,000 level, Binance’s rapidly growing inventory of Bitcoin should be a significant worry for any remaining bulls. Until this excess supply is effectively absorbed by new buying demand, any potential recovery in Bitcoin’s price is likely to be short-lived and fragile. The sheer volume of BTC available for sale could cap any upward movements, making a sustained recovery difficult in the immediate future.
In conclusion, a confluence of bearish technical patterns, concerning on-chain metrics, and significant exchange inflows strongly indicates that Bitcoin’s downtrend is far from over. The confirmed head-and-shoulders pattern targeting $52,650, the bear flag pointing to $65,500 as a liquidity magnet, the Puell Multiple signaling continued bearishness, and the ongoing miner capitulation, all paint a grim picture. Coupled with the massive BTC inflows to Binance, which underscore prevalent selling pressure and FUD, the path of least resistance for Bitcoin appears to be downwards. Investors should exercise extreme caution and prepare for continued volatility and potential further price declines as the market navigates these challenging conditions.
This article does not contain investment advice or recommendations. Every investment and trading move involves risk, and readers should conduct their own research when making a decision. While we strive to provide accurate and timely information, Cointelegraph does not guarantee the accuracy, completeness, or reliability of any information in this article. This article may contain forward-looking statements that are subject to risks and uncertainties. Cointelegraph will not be liable for any loss or damage arising from your reliance on this information.