Bitcoin, the flagship cryptocurrency, found itself navigating treacherous waters in mid-March 2026, struggling to maintain equilibrium around the critical $70,000 psychological barrier as escalating geopolitical tensions surrounding the US-Israel-Iran conflict sent shockwaves across global financial markets, driving crude oil prices higher and causing significant declines in stock markets, thereby fueling widespread investor anxiety over the persistent threat of inflation in the United States. The digital asset’s recent volatility underscored its increasing entanglement with traditional economic and geopolitical forces, demonstrating that even the decentralized world of cryptocurrency is not immune to the seismic shifts occurring on the global stage.
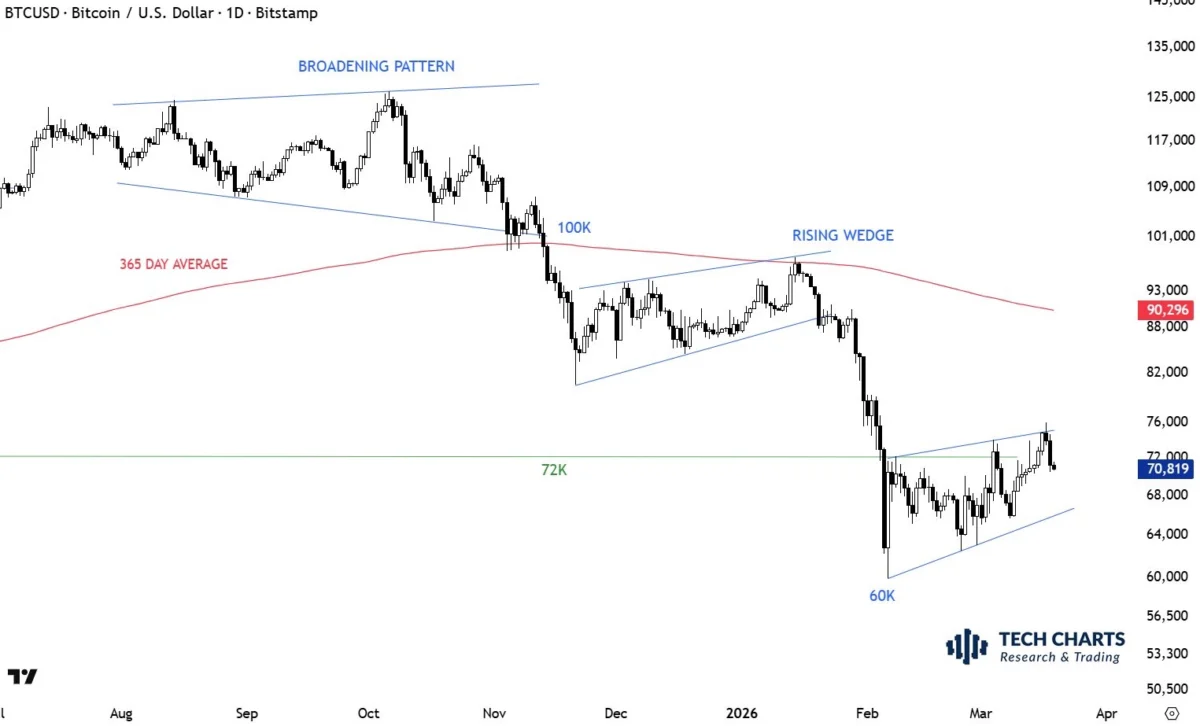
The swift rejection of Bitcoin (BTC) from its recent $76,000 range high on Tuesday, March 12, 2026, which saw a rapid descent and subsequent sell-off below the $70,000 mark, immediately ignited concerns among traders and analysts alike, suggesting that a definitive market bottom might still be elusive for the leading cryptocurrency. This sharp downturn followed a period of cautious optimism, where many had hoped Bitcoin was consolidating for a renewed push towards new all-time highs. However, the confluence of technical resistance and external macro pressures proved too potent.
Chartered market technician Aksel Kibar, a respected voice in technical analysis, prominently suggested via a post on X (formerly Twitter) that the current market structure for Bitcoin bore an unsettling resemblance to a bearish wedge pattern observed between December 2025 and early January 2026. This previous instance had presaged a period of significant price compression and eventual downside. Kibar’s analysis highlighted the precariousness of Bitcoin’s position, warning that a failure to hold current support levels could trigger a more substantial correction. "Breakdown of the lower boundary will be the signal for a possible move towards $52.5K," Kibar explicitly stated, a projection that sent shivers through the market, implying a potential 25% drop from the current $70,000 level. Such a move would liquidate countless leveraged positions and severely test the conviction of long-term holders.
Kibar further elaborated on his methodology, referencing an earlier X social post from January 18, 2026, where he had articulated the necessity for BTC to respect its year-long average price. He described this period as "part of the chop and search for a base," indicating a phase of price discovery and consolidation rather than a clear directional trend. He added that the prevailing pattern could evolve into a "rising wedge, usually bearish in an attempt to test $73.7K-$76.5K support area." A rising wedge, characterized by converging trendlines where both are sloping upwards, typically resolves with a downside breakout, especially when it occurs after a significant price run-up. This suggests that even a retest of higher resistance might merely be a precursor to further declines, trapping late buyers. The technical indicators, therefore, painted a cautious to outright bearish picture, urging traders to exercise extreme prudence.
Bitcoin’s recent tumble below $70,000 was not an isolated event but rather mirrored a broader market downturn, particularly in US equities, where investor confidence evaporated amidst mounting anxieties over soaring crude oil prices, the escalating geopolitical ramifications of the US and Israel-Iran war, and its anticipated inflationary impact. The Middle East conflict, which had been simmering for months, showed signs of dangerous escalation in early March 2026, with reports of direct clashes and strategic infrastructure attacks, particularly in the Persian Gulf region. Concerns centered on the Strait of Hormuz, a vital chokepoint for global oil shipments, through which approximately one-fifth of the world’s total petroleum consumption passes daily. Any disruption there would inevitably send energy prices skyrocketing.
The price of Brent crude, the international benchmark, surged past $110 per barrel, with West Texas Intermediate (WTI) not far behind, hitting levels not seen since the early 2020s. This rapid ascent in energy costs immediately translated into higher input prices for businesses across all sectors, from manufacturing and transportation to agriculture and consumer goods. For consumers, it meant higher prices at the pump, increased utility bills, and ultimately, a reduction in discretionary spending power. Analysts quickly drew parallels to the oil shocks of previous decades, which invariably led to periods of stagflation – a toxic combination of stagnant economic growth and high inflation. The prospect of "what happens to Bitcoin if oil price hits $180 per barrel" became a grim thought experiment for many, with fears that such a scenario would cripple risk assets.

Adding to the economic uncertainty, The Kobeissi Letter, a prominent market commentary, highlighted the drastic shift in expectations regarding the US Federal Reserve’s monetary policy. In a post discussing how the "current decisions by the Trump administration" — likely referring to a combination of fiscal spending, trade policies, and geopolitical strategies that contribute to market instability — could impact inflation, The Kobeissi Letter noted, "The market now sees a 50% chance of a US Fed rate HIKE by the end of 2026. Just months ago, markets saw as many as four rate CUTS this year." This dramatic pivot from anticipated rate cuts to potential hikes underscored the severity of the inflationary pressures perceived by the market. A Fed rate hike would tighten financial conditions, increase borrowing costs for businesses and consumers, and typically dampens enthusiasm for speculative assets like cryptocurrencies, as safer, interest-bearing alternatives become more attractive. The specter of a hawkish Fed, forced to prioritize inflation control over economic growth, weighed heavily on all asset classes, including Bitcoin.
The relationship between Bitcoin and traditional markets continued to evolve, with its recent price action demonstrating a strong correlation with US equities, particularly technology stocks. While some proponents still champion Bitcoin as "digital gold" and an uncorrelated inflation hedge, its behavior during this period of geopolitical and economic turmoil suggested it was acting more as a risk-on asset. When traditional markets tumbled on inflation fears and geopolitical jitters, Bitcoin often followed suit, indicating that a significant portion of its investor base treats it similarly to other high-growth, speculative investments. This correlation challenged the long-held narrative of Bitcoin as a safe haven, especially during times of extreme stress in the broader financial system. The comparison to gold, which historically has performed well during periods of geopolitical uncertainty and inflation, showed Bitcoin still searching for its definitive role in a diversified portfolio. Indeed, some analyses, such as those indicating "Bitcoin vs gold shows potential bottom signals as BTC bulls defend $70K," suggested that while Bitcoin was struggling, its relative strength against gold might offer a glimmer of hope for a rebound.
Further insights into Bitcoin’s market structure came from Glassnode, a leading on-chain analytics firm. In its BTC Options Weekly report, Glassnode analysts concluded that "Bitcoin has reintegrated its range after a short-lived deviation above the $75K level." This meant that the brief breakout attempt above $75,000 was unsustainable, and the price had retreated back into its established trading range, suggesting a lack of conviction from buyers at higher levels. The analysts further explained that within the options market, "short gamma at $75K has been unwound." Short gamma positions, often taken by options sellers, expose traders to significant losses if the underlying asset moves sharply in either direction. The unwinding of these positions typically occurs when volatility increases or when the market moves away from the strike price, indicating that traders who had bet on price stability or limited upside around $75K were forced to close their positions, adding to the selling pressure.
Glassnode’s report succinctly summarized the prevailing sentiment: "Beneath the pullback, the breakout has lost momentum and range conditions are returning." This indicated a shift from a potentially bullish breakout scenario to a more neutral, range-bound environment. The loss of momentum meant that the energy required to push prices higher had dissipated, while the return to range conditions implied that traders should expect price fluctuations within defined boundaries rather than a decisive trend. This environment often favors strategies focused on buying low and selling high within the range, rather than chasing breakouts.
The confluence of these factors – escalating geopolitical conflict, rising energy costs, mounting inflation concerns, a hawkish shift in central bank expectations, and a weakening technical and on-chain outlook for Bitcoin – created a challenging landscape for the cryptocurrency market. While Bitcoin’s resilience had been tested many times before, the specific combination of external macro shocks and internal market dynamics presented a formidable hurdle. Investors watched nervously, weighing the potential for further downside against the long-term bullish narrative of digital assets, as the global financial system grappled with the profound implications of the unfolding geopolitical crisis in the Middle East and its reverberations across economies worldwide. The $70,000 mark was not just a price point; it was a battle line, defining the immediate future of Bitcoin in an increasingly uncertain world.