Key takeaways:
- A potential Japanese Yen intervention could trigger a 30% Bitcoin price drop due to the unwinding of yen carry trades.
- Historical precedents show BTC recovering strongly (100%+ rallies) after such interventions and subsequent shakeouts.
- On-chain indicators like Net Unrealized Profit/Loss (NUPL) and Delta Growth Rate suggest Bitcoin has not yet reached full capitulation, indicating further downside is possible before a durable bottom is formed.
- A drop to the $65,000–$70,000 range is projected if the yen fractal plays out as anticipated.
Bitcoin’s Yen Fractal Shows 30% Drawdowns Before Rebounds
The concept of a "yen intervention" refers to the decisive action taken by Japan’s monetary authorities, primarily the Bank of Japan (BOJ) and the Ministry of Finance (MOF), to influence the exchange rate of the Japanese yen in the foreign exchange market. This typically occurs when the yen experiences rapid and significant depreciation, which can be detrimental to Japan’s economy by increasing import costs, fueling inflation, and eroding the purchasing power of its citizens. The most common form of intervention involves selling U.S. dollars and buying yen to strengthen the Japanese currency, thereby slowing its rapid slide. This maneuver injects liquidity into the market to counter speculative selling pressure and stabilize the currency.
Over the recent weekend, global financial markets were put on high alert following reports that the New York Fed had conducted "rate checks" in the USD/JPY currency pair. For seasoned FX traders, these rate checks are often interpreted as a discreet, yet significant, prelude to potential coordinated action. They involve central banks or government agencies sounding out market participants on current exchange rates and liquidity conditions, essentially gauging the market’s pulse before making a move. This activity closely followed official statements from Japanese and U.S. authorities emphasizing their close coordination on currency matters, underscoring the seriousness of the situation and the potential for a joint intervention. The perceived urgency arises from the yen’s persistent weakness against the dollar, which has been exacerbated by the significant interest rate differential between the dovish Bank of Japan and the hawkish U.S. Federal Reserve.

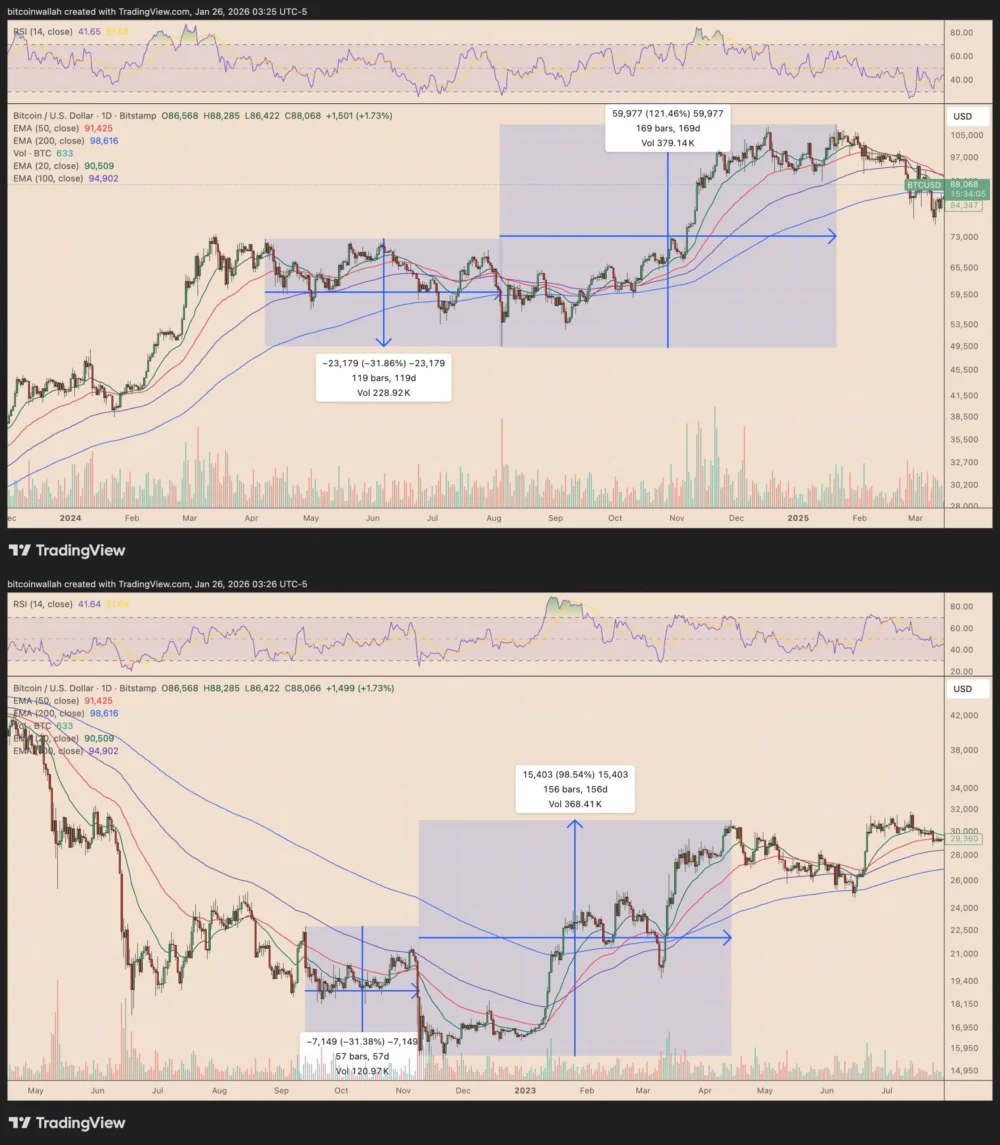
The historical impact of such interventions on Bitcoin’s price is a key factor in the current analysis. In the two prior intervention windows observed, Bitcoin experienced a substantial sell-off, shedding approximately 30% from its local highs. This correlation is largely attributed to the unwinding of what are known as "yen carry trades." A yen carry trade involves borrowing the low-yielding Japanese yen and investing the proceeds in higher-yielding assets or currencies elsewhere. Given Japan’s historically low, often negative, interest rates, the yen has long been a favored funding currency for such strategies, including in the volatile cryptocurrency markets. When a yen intervention occurs, it typically strengthens the yen, making it more expensive to repay yen-denominated loans. This sudden shift often forces traders to liquidate their higher-yielding assets, including Bitcoin, to acquire yen for loan repayment, thus creating significant selling pressure on BTC. The forced unwinding of these positions can lead to sharp, rapid price declines, often referred to as a "shakeout" or "capitulation event."
Interestingly, in both historical instances, the post-shakeout recovery proved to be robust, with Bitcoin eventually extending into rallies of 100% or more from the bottom established after the intervention. This fractal pattern suggests a period of intense pain followed by a strong rebound. Analyst Mikybull Crypto, drawing parallels to these past events, recently remarked on social media, "The same scenario is about to occur now," adding a definitive prediction that the BTC price "will first dump and rally afterward." Should this yen fractal play out as historical precedent suggests, Bitcoin risks declining toward the $65,000–$70,000 range, a level that would represent a significant correction from its recent highs but also potentially lay the groundwork for a future bullish surge. The chart below illustrates the historical correlation, showing how BTC/USD reacted to previous yen intervention periods.
(Please imagine the BTC/USD daily price chart showing correlation with yen interventions here, as described in the original article. This would visually reinforce the fractal pattern.)
Bitcoin On-Chain Metrics Reinforce Bearish Outlook
Beyond the macroeconomic factors influencing currency markets, a deeper dive into Bitcoin’s on-chain metrics further reinforces the notion that the asset has not yet reached full capitulation and is still awaiting a "true bottom." According to data resource Alphractal, several key indicators point towards this conclusion, suggesting that while price corrections have occurred, the market hasn’t yet experienced the exhaustive flush-out typically associated with a generational buying opportunity.

One of the primary indicators supporting this view is the Net Unrealized Profit/Loss (NUPL). NUPL is a powerful on-chain metric that tracks the aggregate unrealized profit or loss of all coins currently held by Bitcoin holders. It calculates the difference between market value and realized value, normalized by market cap. Essentially, it shows whether the majority of Bitcoin holders are sitting on paper gains or paper losses. NUPL operates within distinct psychological zones: from "Capitulation" (deep red, signifying significant aggregate losses) to "Disbelief," "Optimism," "Euphoria," and back to "Hope/Fear."
As of Monday, NUPL was observed to be falling but critically, it remained above zero. This signifies that despite recent drawdowns, the overall market still remains in a net "in profit" state. Historically, Bitcoin’s definitive bottoms, often marking the end of bearish cycles or significant corrections, have tended to form only after NUPL turns negative and enters the "Capitulation" zone. A negative NUPL indicates that the vast majority of holders are underwater, meaning their average cost basis is higher than the current market price. This condition is crucial because it signals that selling pressure has largely been exhausted; those who bought at higher prices and were unwilling to sell at a loss have either already capitulated or are strong hands. When this occurs, the market is typically "washed out," paving the way for a more sustainable recovery. The current reading, with NUPL still positive, suggests that more pain might be necessary to trigger the widespread capitulation that precedes a true market bottom.
As Cointelegraph previously reported, the supply in profit currently stands at 62% – the lowest level recorded since September 2024, when Bitcoin was trading around the $30,000 mark. While this is a notable decline, it still implies that a significant portion of the market participants are holding unrealized gains. For a true bottom to form, this percentage typically needs to drop further, pushing more holders into an unrealized loss position, thus cleansing the market of weaker hands and speculative froth.
(Please imagine the Bitcoin NUPL vs. price chart here, showing NUPL still above zero, as described in the original article. This would visually represent the current state.)
Concurrently, Bitcoin’s delta growth rate has also turned negative, adding another layer to the bearish outlook. This metric compares Bitcoin’s market value with its realized value. Market value (MV) represents the current price of Bitcoin multiplied by its circulating supply, reflecting the total valuation of the network at any given moment. Realized value (RV), on the other hand, is the sum of all coin prices at the time they last moved on the blockchain. It effectively represents the aggregate cost basis of the entire Bitcoin network, as it filters out coins that haven’t moved in a long time and gives more weight to recent transactions.

A drop in the delta growth rate below zero indicates that the market price is slipping towards (or even below) the network’s aggregate cost basis. When the market value approaches or falls below the realized value, it signals a period where the market is cooling down significantly, moving away from speculative fervor and into an accumulation phase. In such periods, many investors find themselves holding coins worth less than their purchase price, which can lead to further selling pressure from those unwilling to hold through deeper losses. Historically, such conditions have often preceded major market bottoms, as they represent periods of intense value discovery and accumulation by long-term holders.
(Please imagine the Bitcoin’s delta growth rate vs. price chart here, showing the rate turning negative, as described in the original article. This would visually represent the current state.)
In simple terms, the combined signals from these on-chain data points suggest that the Bitcoin market, despite recent corrections, is still vulnerable to another significant drawdown before a durable and sustainable bottom is definitively set. This process, while undeniably painful for many investors, is often a necessary cleansing mechanism in market cycles. Alphractal aptly describes this phase as one that can set up "generational buying opportunities," a sentiment that aligns perfectly with the yen-intervention fractal’s historical pattern of a sharp drop followed by a substantial recovery. The confluence of these macroeconomic and on-chain signals paints a picture of a market poised for a critical phase, where short-term volatility could pave the way for long-term gains for those with conviction and patience.
This article does not contain investment advice or recommendations. Every investment and trading move involves risk, and readers should conduct their own research when making a decision. While we strive to provide accurate and timely information, Cointelegraph does not guarantee the accuracy, completeness, or reliability of any information in this article. This article may contain forward-looking statements that are subject to risks and uncertainties. Cointelegraph will not be liable for any loss or damage arising from your reliance on this information.