The recent price retreat underscores a visible shift in market dynamics, where the influence of derivatives trading appears to be temporarily overshadowing spot market activity. A critical indicator of this shift is the Coinbase premium gap, which recently flipped negative after a sustained period of robust demand. This metric, which measures the price difference between Bitcoin on Coinbase (a major exchange for US institutional and retail investors) and other global exchanges, provides valuable insight into US-based buying pressure. A negative premium implies that Bitcoin is trading at a discount on Coinbase compared to other platforms, signaling a waning appetite from US investors, potentially indicative of reduced institutional inflows into spot Bitcoin ETFs or increased profit-taking among retail participants. This stalling demand is a significant factor in the current market weakness, as US buying has historically been a powerful catalyst for Bitcoin’s price appreciation.
Further solidifying the narrative of derivatives-led selling, crypto analyst IT Tech highlighted a stark imbalance between the spot and perpetual futures markets. An analysis of the Cumulative Volume Delta (CVD), a sophisticated metric that tracks the net buying versus selling pressure across various markets, revealed a substantial divergence. The spot CVD, reflecting direct buying and selling of Bitcoin, saw a decline of $40.64 million. In stark contrast, the perpetual CVD, which represents activity in futures contracts that have no expiration date, plummeted by an astonishing $506.75 million. This tenfold difference in selling pressure unequivocally points to a more aggressive disposition from leveraged traders in the derivatives markets. The substantial drop in perpetual CVD indicates that a significant volume of leveraged long positions were either closed out or liquidated, contributing heavily to the downward price momentum. Such concentrated selling from leveraged positions can amplify price swings, creating a cascading effect as liquidations trigger further selling.

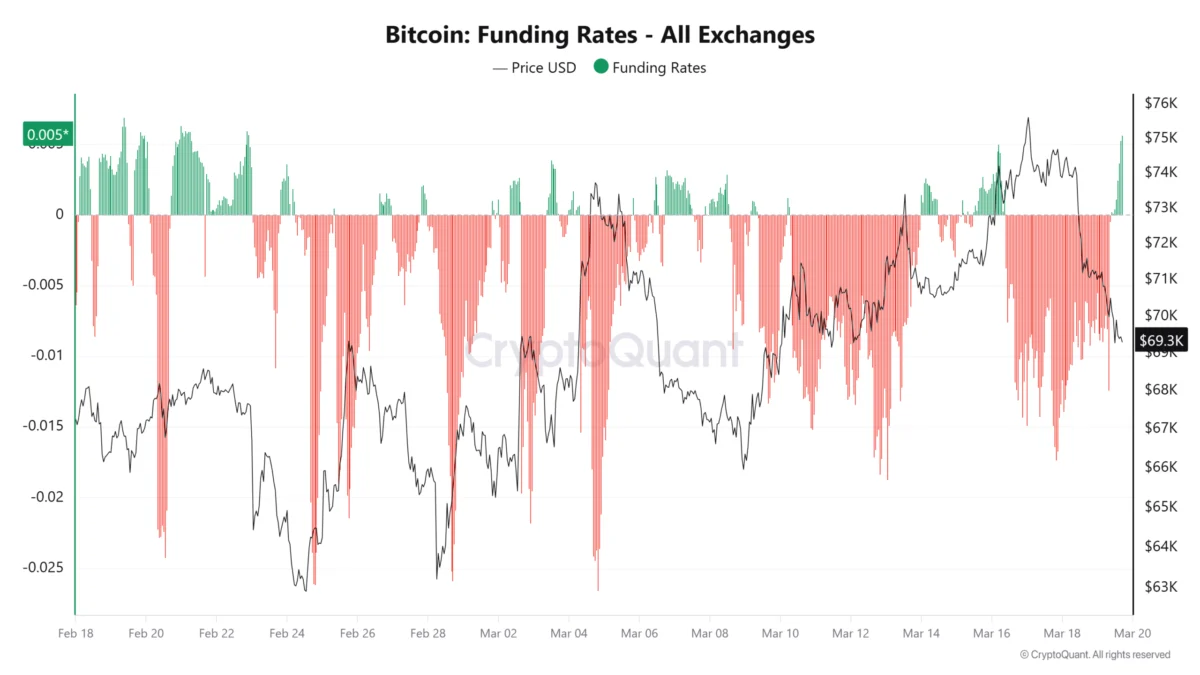
Despite this aggressive selling in perpetual futures, an intriguing counter-signal emerges from the funding rates. Funding rates, which are periodic payments exchanged between long and short traders in perpetual futures contracts, are designed to keep the futures price aligned with the spot price. When funding rates are positive, long position holders pay short position holders, indicating a predominant bullish bias in the market. Currently, Bitcoin’s funding rates have flipped positive to 0.05%, suggesting that despite the recent sell-off and heavy perpetual CVD, the overall sentiment among the remaining leveraged traders leans towards a long bias. This could imply that much of the "weak hands" or excessively leveraged long positions have been flushed out, leaving a more resilient base of bullish traders. This positive funding rate, juxtaposed with the heavy CVD selling, creates a complex picture where the market might be undergoing a necessary cleansing, preparing for a potential reversal. Moreover, detailed order book data further reinforces this underlying resilience, showing significant bid-side support holding firm near the $70,000 region. This suggests that a substantial number of buy orders are placed at or around this price point, indicating a strong level of interest from buyers willing to step in. The fact that both spot and perpetual markets are leaning towards buyers in their order books, despite the recent price drop, hints at an underlying demand structure that could absorb further selling pressure and potentially fuel a bounce.
Delving into technical analysis, Bitcoin is currently exhibiting a fractal setup that bears a striking resemblance to the price action observed between March 6 and March 8. During that period, Bitcoin experienced a notable correction, declining significantly before ultimately sweeping internal liquidity levels and orchestrating a robust reversal to higher price points. The current market movement appears to be following an identical sequence, characterized by a series of successive lower lows. This pattern often develops into what technical analysts refer to as a "potential exhaustion phase" for the price. An exhaustion phase suggests that the selling pressure is reaching its limits, and the market may be primed for a turnaround as sellers become depleted.
A key element of the previous breakout and subsequent reversal was the formation of a bullish divergence on the Relative Strength Index (RSI) indicator. The RSI is a momentum oscillator that measures the speed and change of price movements, ranging from 0 to 100 to identify overbought or oversold conditions. In the March recovery, the RSI held equal lows or even printed higher lows while the price itself continued to make lower lows. This divergence is a classic bullish signal, indicating that while the price is falling, the momentum of the selling pressure is actually weakening. Intriguingly, a comparable bullish divergence is now actively developing on the lower timeframes, further strengthening the case for the bullish fractal structure to play out again. This recurring pattern, particularly when supported by momentum indicators, often precedes significant price reversals.

Complementing this technical setup, liquidation data provides additional credence to the potential for a rebound. In both the current scenario and the March 6-8 recovery, significant long-side liquidations have been observed. Liquidations occur when leveraged positions are automatically closed out by exchanges due to insufficient margin to cover losses, often amplifying price moves. While painful for individual traders, these liquidations serve a crucial function in the market: they reduce the overall open interest in derivatives and effectively flush out overleveraged positions. This "cleansing" process removes excess speculation and leverage from the system, making any subsequent upward price movements more sustainable and less prone to immediate reversals triggered by another wave of liquidations. The market becomes healthier and more balanced after such events.
Looking ahead, a swift reclaim of the $70,000 level would be a critical bullish confirmation, aligning perfectly with the trajectory observed during the previous fractal recovery. Such a move would not only solidify the short-term support but also pave the way for a potential ascent toward the range highs near $76,000. Within this potential recovery path, the $72,000 level stands out as a key pivot point. A decisive reclaim and consolidation above $72,000 could trigger a short squeeze. A short squeeze occurs when the price of an asset rapidly increases, forcing short sellers (who bet on a price decline) to buy back the asset to limit their losses. This buying pressure further fuels the price increase, creating a powerful upward momentum. If short positions are trapped above $72,000, their forced covering could provide a significant boost to Bitcoin’s price.
However, the bullish fractal setup is inherently time-sensitive and dependent on immediate market reactions. A breakdown below the critical support level of $68,300 would invalidate the current bullish short-term thesis, shifting the market’s focus towards lower price targets. In such a scenario, the next significant areas of support would be found near $65,000 and subsequently $62,000. These levels are often identified as "higher time frame liquidity" zones, meaning they represent strong demand areas that have historically attracted significant buying interest on longer-term charts, making them potential strongholds for price stabilization.

Trading Stables founder Ryan Scott underscored the importance of the $73,000 level, flagging it as a crucial base for Bitcoin. According to Scott, a failure to stabilize and sustain price action above this level would signal a weak buyer response, suggesting that the underlying demand is not strong enough to absorb selling pressure. Such a scenario would significantly increase the probability of Bitcoin descending further to revisit the range lows, potentially near the $62,000 mark. This perspective aligns with the technical analysis that highlights the importance of reclaiming key resistance levels to confirm a sustainable upward trend.
In conclusion, Bitcoin’s recent sell-off, while sharp, appears to be contained around the $70,000 region, with a confluence of technical indicators and on-chain data pointing towards a potential rebound. The market has witnessed significant selling pressure from leveraged traders and a temporary decline in US spot demand, yet positive funding rates and strong bid-side support suggest underlying resilience. The developing bullish RSI divergence and fractal setup, mirroring a successful recovery in early March, offer a compelling narrative for a bounce. The reclaim of $70,000 and, more critically, $72,000 could ignite a short squeeze and propel Bitcoin back towards $76,000. Conversely, a breakdown below $68,300 would negate this bullish outlook, opening the door for a deeper correction towards $65,000 and $62,000, where higher time frame liquidity awaits. As always, the cryptocurrency market remains highly dynamic and subject to rapid shifts, necessitating vigilant monitoring of these key price levels and market indicators to ascertain Bitcoin’s next major move.
This article does not contain investment advice or recommendations. Every investment and trading move involves risk, and readers should conduct their own research when making a decision. While we strive to provide accurate and timely information, Cointelegraph does not guarantee the accuracy, completeness, or reliability of any information in this article. This article may contain forward-looking statements that are subject to risks and uncertainties. Cointelegraph will not be liable for any loss or damage arising from your reliance on this information.