Key takeaways:
- Bitcoin’s inability to decisively break above $90,000 in December, following a significant pullback from its October all-time high of $126,000, has placed it in a critical consolidation phase. This sideways movement, characterized by sharp rejections at $90,000 and bounces from the $85,000-$87,000 range, mirrors historical patterns seen in previous four-year cycle downtrends, suggesting a period of calm before a potential storm.
- Analyst Bull Theory highlights a delayed correlation between Bitcoin and traditional safe-haven assets like gold and silver. Historically, precious metals rally first during market stress, with Bitcoin’s significant surges often following their peaks, as seen in the 2020-2021 cycle. The current scenario, where gold and silver have hit new all-time highs while BTC consolidates, points towards a potential rotation of capital into Bitcoin in early 2026.
- The Bitcoin Cost Basis Distribution (CBD) heatmap reveals a substantial supply cluster around the $84,000-$85,000 range, representing over 940,000 BTC. Such dense accumulation zones have historically preceded strong uptrends, acting as robust support levels. This indicates strong conviction among holders and a significant psychological and technical floor for the price.
- Despite recent pressure on miners due to rising energy costs and a slight dip in the Bitcoin hash rate, historical data suggests miner capitulation can be a bullish contrarian signal. VanEck’s analysis indicates that sustained hash rate declines have often led to positive Bitcoin price returns over the subsequent 90 to 180 days, making the hash rate a crucial indicator for a potential price rebound in 2026.
- Technically, Bitcoin’s weekly chart shows critical support at its 100-week Exponential Moving Average (EMA). Maintaining this level is vital for preserving the broader uptrend structure. A rebound towards the 50-week EMA near $97,000-$98,000 is plausible if support holds, while a decisive break below the 100-week EMA could signal deeper corrections towards the 200-week EMA at $67,500-$66,000, presenting a make-or-break scenario for the coming year.
Bitcoin (BTC) found itself in a precarious position in December, unable to firmly establish itself above the psychologically significant $90,000 mark. Repeated attempts to breach this resistance were met with sharp rejections, pushing the price back towards the $85,000-$87,000 area. This persistent sideways price action has left investors and analysts alike pondering the cryptocurrency’s immediate future as 2026 looms, with many viewing the current phase as a make-or-break moment that could dictate Bitcoin’s trajectory for the foreseeable future.


This period of consolidation followed a substantial pullback of over 30% from Bitcoin’s impressive October all-time high, which had soared above the $126,000 mark. The rapid ascent to such heights had fueled widespread bullish sentiment, but the subsequent correction and stagnant price action have introduced a degree of uncertainty. However, seasoned market observers noted that Bitcoin’s current sideways movement bears a striking resemblance to pauses observed during previous four-year cycle downtrends. In these historical instances, Bitcoin’s price often consolidated for extended periods, building a base before a clearer and more definitive trend emerged, as highlighted by multiple analysts. The question remains: as 2026 rapidly approaches, will this seemingly ‘boring’ BTC range give way to a powerful breakout to new highs, or will it succumb to a deeper, more prolonged correction?
Related: Bitcoin’s $90K rejection: Is BTC’s digital gold narrative losing to bonds?
Gold, silver charts: Lagging BTC price correlation
One compelling argument for a potential bullish breakout in Bitcoin comes from an analysis of its correlation, or rather, its *lagging* correlation, with traditional safe-haven assets like gold and silver. Analyst Bull Theory points out that Bitcoin’s recent 30% pullback and subsequent sideways trading are entirely consistent with historical liquidity cycles. In a detailed Monday note, the analyst elucidated that gold (XAU) and silver (XAG) typically serve as initial beneficiaries during periods of significant market stress or uncertainty, attracting capital first. Bitcoin, on the other hand, tends to lag in this rotation, often seeing its major price movements after the precious metals have had their run.
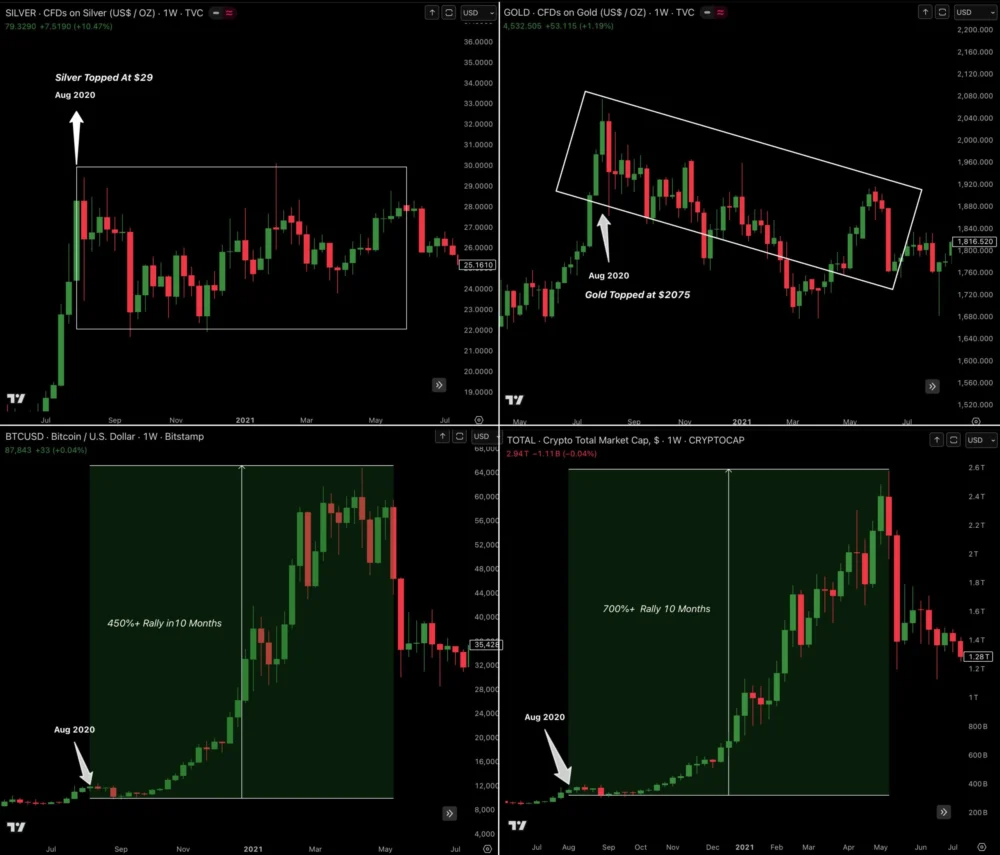
A prime example of this phenomenon was observed during the May-August 2020 period. While gold and silver rallied strongly, indicating a flight to safety amid global economic concerns, Bitcoin remained largely range-bound, trading predominantly within the $9,000-$12,000 corridor. This period of relative stagnation for BTC contrasted sharply with the booming precious metals market.

“Gold and silver peaked in August 2020, and that’s precisely when money started rotating into risk assets,” Bull Theory explained, providing historical context. The analyst further elaborated on the subsequent shift: “From August 2020 to May 2021: Bitcoin went from $12,000 to $64,800, a staggering nearly 5.5x increase. Concurrently, the total crypto market cap surged by almost 8x by mid-2021, illustrating the profound impact of this capital rotation.”
A remarkably similar pattern has been unfolding as of December 2025. Gold and silver have recently achieved their respective all-time highs, signaling strong demand for traditional safe havens. Yet, Bitcoin remains in its consolidation phase, seemingly unaffected by the broader market’s renewed interest in precious metals. This parallel strongly hints that the top cryptocurrency may once again benefit from a delayed rotation of risk capital, much like it did following August 2020. “That is why the current sideways action in BTC is not the start of a bear market, but rather a calm before the storm,” Bull Theory concluded, suggesting that patient investors could be rewarded in the coming year as liquidity potentially flows into the crypto market.
Bitcoin cost basis
Another crucial chart to monitor closely as 2026 unfolds is Bitcoin’s Cost Basis Distribution (CBD) heatmap. This sophisticated on-chain metric, provided by Glassnode, offers invaluable insights into the distribution of Bitcoin supply across different price levels. In essence, it visualizes where the majority of Bitcoin holders acquired their coins, thereby identifying potential zones where significant buying or selling pressure is likely to emerge. These clusters represent strong conviction among holders, as they are the prices at which a large amount of capital entered the market.
As of December, the heatmap highlighted an extraordinarily dense supply cluster, indicating that over 940,000 BTC were accumulated within the tight $84,000–$85,000 range. This represents the largest concentration recorded since 2020, signaling a robust foundation of support. Historically, the emergence of such significant supply zones has often preceded strong Bitcoin uptrends, acting as powerful springboards for future price appreciation. These zones demonstrate collective conviction, where a large number of market participants believe Bitcoin is undervalued or fairly priced, absorbing sell-side pressure and establishing a strong floor.

For instance, in early 2023, heavy buying activity around the $16,000 mark created a formidable base. Over the subsequent year, Bitcoin climbed steadily from that zone, eventually surging above $38,000, illustrating the power of these accumulation areas. Similarly, in 2025, Bitcoin experienced a temporary drop to the $75,000-$76,000 range, despite strong accumulation observed earlier within the $96,000-$98,000 zone. Crucially, BTC later recovered back into that high-accumulation zone, demonstrating that buyers were willing to step in again to defend their positions rather than abandon them. This resilience underscores the importance of these cost basis clusters as reliable indicators of underlying market strength and conviction among long-term holders. The current cluster at $84,000-$85,000 suggests a strong base has been formed, which could provide the necessary launchpad for Bitcoin’s next leg up in 2026.

Bitcoin hash rate chart
The Bitcoin mining industry has faced significant headwinds, primarily driven by rising energy costs which have squeezed profit margins for many operators. This challenging environment has compelled some miners to seek alternative financing methods, such as debt or equity-linked solutions, merely to maintain liquidity and operational continuity. Against this backdrop of heightened miner stress, the Bitcoin network’s hash rate, a measure of the total computational power dedicated to processing transactions and securing the network, has experienced a notable dip after peaking in late October. This decline has naturally raised concerns about the health and stability of the mining ecosystem and its potential implications for Bitcoin’s price.

However, analysts at VanEck offer a contrasting perspective, viewing this trend through a more optimistic lens. In a recent research note, Matt Sigel, VanEck’s head of crypto research, articulated that miner capitulation—a period where less efficient or financially strained miners are forced to shut down their operations—has historically served as a “bullish contrarian signal.” This phenomenon often marks a cleansing of the network, where weaker hands are flushed out, leaving only the most efficient and resilient miners. Historically, Bitcoin has shown positive 90-day returns approximately 65% of the time following sustained hash rate declines, according to VanEck’s data. The bullish case strengthens over a longer horizon: Bitcoin’s price rose an impressive 77% of the time over the following 180 days, with an average gain of about 72% after such periods of sustained hash rate declines. This recurring fractal makes Bitcoin’s hash rate a pivotal chart to observe in 2026, as a continued decline followed by stabilization could herald a significant upward price movement.
Bitcoin’s weekly trendline support
From a technical analysis perspective, Bitcoin’s weekly chart provides critical insights into why the current ‘boring’ range holds such significance as the market transitions into 2026. As of December, BTC has been consolidating sideways, but crucially, it has maintained its position above its 100-week exponential moving average (100-week EMA), often referred to as the ‘purple wave’ on charting platforms. This moving average acts as a dynamic support level, reflecting the average price over a longer period and often serving as a psychological and technical floor for price action.

As long as Bitcoin’s price continues to hold near or above this significant support zone, the broader uptrend structure remains intact, even if immediate momentum appears muted. This suggests that despite the current stagnation, the long-term bullish narrative has not been invalidated. In such a scenario, where the 100-week EMA holds firm, BTC could logically rebound towards its 50-week EMA (the ‘red wave’), which currently sits around the $97,000-$98,000 zone. A successful retest and potential breach of the 50-week EMA would signal renewed buying pressure and a potential acceleration of the uptrend.
However, the alternative scenario presents a more cautious outlook. A sustained and decisive break below the 100-week EMA would be a significant technical bearish signal, raising the risks of deeper pullbacks. In this event, the next major support level to watch would be the 200-week EMA (the ‘blue wave’), positioned around the $67,500-$66,000 area. A descent to the 200-week EMA typically indicates a more severe market correction or even the confirmation of a bear market, often associated with widespread capitulation among weaker holders. This makes the 100-week EMA a pivotal line in the sand; holding it could pave the way for a resurgence, while failing to do so could usher in a period of sustained downside pressure, truly making 2026 a make-or-break year for Bitcoin’s price trajectory.
The confluence of these analytical perspectives paints a complex yet fascinating picture for Bitcoin in 2026. The historical correlation with precious metals suggests a delayed but powerful bullish impulse, while strong accumulation zones indicate robust underlying support. Miner capitulation, often a harbinger of market bottoms, adds to the contrarian bullish sentiment. However, the critical weekly technical levels, particularly the 100-week EMA, serve as an immediate litmus test for the sustainability of the broader uptrend. Whether Bitcoin finally breaks free from its $90,000 shackles to reclaim its bullish momentum or succumbs to deeper corrections will depend on how these key charts unfold. Beyond these technical and on-chain metrics, broader macroeconomic factors, institutional adoption trends, and evolving regulatory landscapes will also play crucial roles in shaping Bitcoin’s fate. Investors are advised to closely monitor these indicators and conduct thorough research as they navigate the potentially volatile, yet opportunity-rich, market of 2026.
This article does not contain investment advice or recommendations. Every investment and trading move involves risk, and readers should conduct their own research when making a decision. While we strive to provide accurate and timely information, Cointelegraph does not guarantee the accuracy, completeness, or reliability of any information in this article. This article may contain forward-looking statements that are subject to risks and uncertainties. Cointelegraph will not be liable for any loss or damage arising from your reliance on this information.