The digital asset, often hailed as "digital gold," experienced a significant pullback, touching multiday lows of $66,569 for BTC/USD according to data from TradingView. This dip positioned Bitcoin below its critical 200-day Exponential Moving Average (EMA), a trend line it had repeatedly attempted and failed to reclaim as sustained support in recent weeks. The broader market sentiment remained cautious, with geopolitical tensions in the Middle East casting a long shadow over global financial markets, prompting a flight to perceived safe havens and commodities.
BTC Price: The 200-Week Trend Line Under the Microscope
The technical landscape for Bitcoin is currently dominated by its interaction with key moving averages, particularly the 200-week Exponential Moving Average (EMA). This specific indicator is often regarded by analysts as a pivotal benchmark, distinguishing between long-term bullish and bearish trends. Its significance stems from its historical role: during bull markets, it frequently acts as a strong support level, while in bear markets, it transforms into a formidable resistance.

Over the past weekend, Bitcoin’s price action saw it dip below the 200-day EMA, and more critically, it struggled to maintain a position above the 200-week EMA, which was hovering around $68,310. Trader and analyst Rekt Capital underscored the gravity of this situation in an X post, noting that Bitcoin had "once again upside wicked beyond the 200 EMA, with price cancelling out the vast amount of the recent rebound." He further cautioned that a weekly candle close below this crucial EMA "would continue to solidify the EMA as resistance," suggesting a more prolonged period of struggle for upside momentum. Historical data supports this concern, as BTC/USD last experienced a weekly close beneath this trend line in early March 2023, preceding a period of consolidation before a significant breakout.
However, not all technical analysts share a purely bearish outlook. Trader Merlijn offered an optimistic counter-narrative, suggesting that Bitcoin’s current price structure might be mirroring a pattern observed in 2023. He highlighted that in 2023, the 200-week EMA served as a "launchpad" for a substantial rally. After reclaiming the EMA, Bitcoin retested it as support before exploding higher. Merlijn argued that BTC is now "back at the same structure near $65K," implying that a successful hold of this level could lead to a similar continuation of the rally. Conversely, a failure to hold would open the door to further downside. This "2023 fractal" provides a glimmer of hope for bulls, suggesting that the current retest, while nerve-wracking, could be a necessary precursor to a renewed upward trajectory. The interplay between Rekt Capital’s cautious analysis and Merlijn’s optimistic fractal creates a highly contested zone around the 200-week EMA, making the upcoming weekly close particularly critical for determining Bitcoin’s near-term direction.
All Eyes on Oil and Gold: Macro Forces Driving Bitcoin’s Trajectory
Beyond the intricate world of technical charts, Bitcoin’s price action is increasingly intertwined with broader macroeconomic developments. The ongoing geopolitical tensions, particularly the Middle East conflict, have injected significant uncertainty into global markets, prompting investors to seek safety in traditional haven assets. This dynamic creates a complex environment for risk assets like Bitcoin, whose correlation with traditional markets continues to evolve.

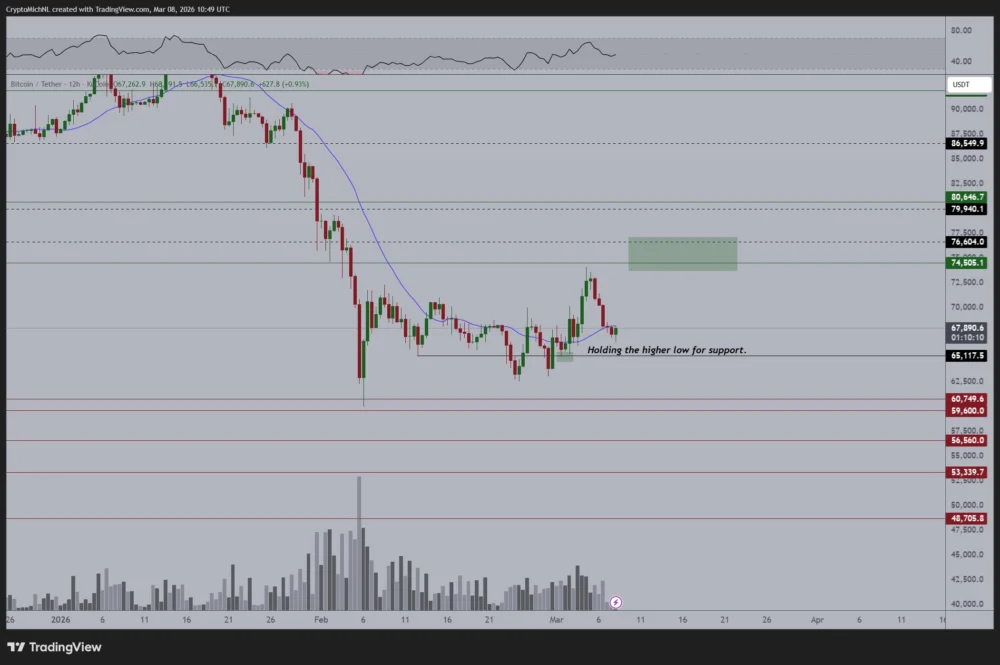
Crypto trader, analyst, and entrepreneur Michaël van de Poppe articulated this sentiment, emphasizing the critical role of commodity performance in Bitcoin’s immediate future. In a post to his X followers, he stated, "All eyes on Oil tomorrow, and Gold & Silver. If those are moving in favor of Bitcoin, we might see a return to the highs in the coming week and the worst is behind us." This suggests that a strong performance in these commodities, perhaps indicating a stabilized or improving global outlook, could indirectly bolster confidence in Bitcoin. However, he also laid out a clear contingency plan for a less favorable scenario: "If that’s not the case, I’d be a big buyer in the $60K areas if we test the lows again." This statement forms the core of his thesis, positioning the $60,000 mark as a strategic entry point should macro headwinds intensify and push Bitcoin lower.
The performance of these commodities over the past week underscored their importance. WTI crude oil, a key indicator of global economic activity and inflationary pressures, ended Friday up nearly 16% on the day, reflecting heightened geopolitical risk premiums. Gold, the perennial safe haven, coiled beneath the $5,200 mark after a failed attempt to rematch its all-time highs. These movements indicate a market bracing for potential instability, with capital flowing into assets traditionally perceived as hedges against inflation and geopolitical turmoil.
Van de Poppe further elaborated on the relative valuation between Bitcoin and gold, drawing attention to the Relative Strength Index (RSI) readings for the BTC/Gold ratio. He flagged "record low relative strength index (RSI) readings," asserting that "The valuation of $BTC vs. Gold isn’t changed." His analysis suggests that "It’s still the lowest RSI in history of that particular metric, which is still: – Gold is overvalued in the short term. – Bitcoin is undervalued in the short term." This perspective is crucial for understanding Bitcoin’s "digital gold" narrative. If gold is seen as overvalued and Bitcoin as undervalued in comparison, it implies a potential catch-up rally for Bitcoin, especially if investors start rotating out of traditional gold into its digital counterpart once macro fears subside or as they seek higher growth potential. This valuation discrepancy reinforces the idea that a dip in Bitcoin, particularly to the $60,000 range, might represent a significant buying opportunity for those who believe in its long-term value proposition relative to other safe-haven assets.
The Broader Market Context and Future Outlook

Bitcoin’s current market position is a confluence of internal technical dynamics and external macroeconomic forces. The struggle around the 200-week EMA is not just a technical indicator; it’s a psychological battleground for bulls and bears, determining whether the asset can resume its upward trajectory or consolidate further. The optimistic "2023 fractal" scenario provides hope for a quick recovery, but the cautionary notes from Rekt Capital highlight the risks of sustained resistance.
Meanwhile, the shadow of global geopolitics and the performance of traditional commodities add another layer of complexity. The Middle East conflict, coupled with fluctuating oil and gold prices, dictates investor appetite for risk. A continued surge in commodities, driven by fear and inflation concerns, could divert capital from riskier assets like Bitcoin. However, as Michaël van de Poppe suggests, this very diversion could create an attractive entry point for Bitcoin, especially if its valuation against gold signals a short-term undervaluation. The $60,000 price target isn’t just an arbitrary number; it represents a level where technical support might converge with a perceived macro-driven discount, making it a strategic area for accumulation.
Looking ahead, the market will be closely watching several factors. The upcoming weekly close for Bitcoin is paramount, as it will either confirm the 200-week EMA as resistance or indicate a successful retest of a historical launchpad. Beyond that, the performance of oil and gold in the traditional trading week will offer significant clues about broader market sentiment and the appetite for risk versus safety. Bitcoin’s evolving narrative as both a risk asset and a potential inflation hedge means it will continue to react to these diverse pressures. The institutional interest, evidenced by the success of spot Bitcoin ETFs in various regions (though not explicitly mentioned as a driver for this specific weekend, it remains a background factor for overall demand), suggests a growing maturity for the asset, yet its susceptibility to macro forces remains undeniable. The current volatility underscores that while the long-term bullish case for Bitcoin remains strong for many, the path to new highs is unlikely to be linear, with strategic dips potentially offering opportune moments for patient investors.
This article does not contain investment advice or recommendations. Every investment and trading move involves risk, and readers should conduct their own research when making a decision. While we strive to provide accurate and timely information, Cointelegraph does not guarantee the accuracy, completeness, or reliability of any information in this article. This article may contain forward-looking statements that are subject to risks and uncertainties. Cointelegraph will not be liable for any loss or damage arising from your reliance on this information.