Bitcoin (BTC) commences the third week of March grappling for a definitive breakout, having recently touched the precipice of $75,000, as a confluence of formidable macroeconomic pressures and entrenched seller resistance at this key psychological level creates a highly volatile trading environment. Following a robust push toward the weekly close, Bitcoin bulls managed to propel the price to $74,425, marking fresh six-week highs and instilling cautious optimism. Data from TradingView confirms that BTC/USD has successfully maintained its crucial position above $70,000 as the traditional finance (TradFi) trading week unfolds. This recent upward trajectory enabled Bitcoin to reclaim several pivotal technical trend lines: notably, the 200-week exponential moving average (EMA) at $68,300 and its prior 2021 record high of $69,400. Furthermore, the cryptocurrency now trades above its 50-day simple moving average (SMA) for the first time since mid-January, a development that often signals a shift in short-to-medium term momentum.

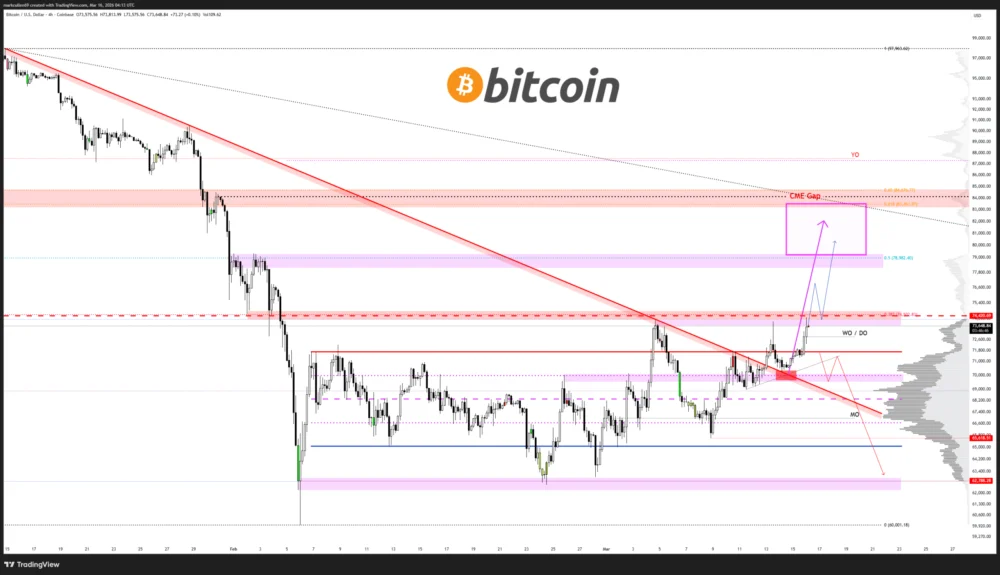
Independent analyst Filbfilb, commenting on the 50-day SMA reclaim, noted on his Telegram channel, “Dips being bought continuously. Another continued squeeze up seems likely to me,” suggesting sustained buying interest beneath current price levels. However, the path ahead is not without significant hurdles. Traders like CrypNuevo highlight the $75,000 zone as the next immediate target, a level characterized by substantial seller interest and formidable resistance. CrypNuevo’s analysis of a “4h long wick” on the chart indicated a potential for an initial drop on the Monday futures open, offering a lower entry point before a possible ascent. He further elaborated that if the price successfully fills that wick, it would likely continue towards $75,000, where he would begin to favor short positions, anticipating a potential reversal at $75,000 or a stronger resistance point at $79,000. Crucially, CrypNuevo issued a stark warning regarding the broader macro scenario: any de-escalation or end to the ongoing Israel-Iran conflict could trigger a "pump and dump" setup. In such a scenario, the market might initially surge on positive news, only to swiftly reverse and shed most or all of its gains, trapping late long positions and underscoring the fragility of current market sentiment amidst geopolitical uncertainties.

Skepticism remains a dominant theme among many market commentators. Trader Killa, for instance, found little compelling reason to abandon a bearish outlook, pointing to several red flags: "So wait a minute… We have 7 green consecutive daily candles, We pump over the weekend, We form a CME gap below, Directly into supply/liquidity, At the start of a new weekly open, And all of a sudden $BTC is bullish? Got it." The presence of a CME gap, formed when the Bitcoin price on traditional futures markets (CME) opens at a different level than where it closed, often acts as a magnet for price, with traders expecting it to be "filled" eventually. This, combined with the other factors, fueled his bearish stance. Meanwhile, trader and analyst Mark Cullen stressed the critical importance of Bitcoin clearing its swing low from April 2025 around the $75,000 mark. He warned X followers, "Lose 71K now and range lows are coming!" highlighting the precarious balance and the potential for a sharp downside if key support fails.

Adding to the long-term caution, the implications of a recent "death cross" on the BTC/USD weekly chart continue to linger. As Cointelegraph previously reported, a death cross — typically when a shorter-term moving average (like the 21-week SMA) crosses below a longer-term moving average (like the 100-week SMA or 200-week SMA) — is a historically bearish technical signal. Keith Alan, co-founder of trading resource Material Indicators, flagged this particular death cross as a significant reason to anticipate new macro lows. In his video analysis, Alan asserted, "As we sit right now on this very day, we are still in a bear market, and this death cross specifically gives me more confidence in the idea that price is likely, at a macro level, to at least go back and test support before a breakout here." He suggested that the support in question could be the local range lows near $60,000, or even the formidable 200-week simple moving average (SMA) at $58,900. A move to the latter would signify a new lower low, a pattern that "often leads to new lower lows." Alan emphasized the need for vigilance: "And we could chop here all month, but don’t forget — don’t turn a blind eye to this structure and to this 200-week moving average." He did, however, offer a potential condition for a change in this bearish outlook: a reversal on lower timeframes, specifically a "decisive uptick" for the 21-day SMA.

The week ahead is further complicated by a multitude of macro volatility catalysts, creating a tense but potentially exhilarating period for markets. The escalating geopolitical tensions surrounding the US and the Israel-Iran conflict continue to cast a long shadow, driving concerns over global oil supplies. These concerns are directly fueling renewed US inflation anxieties, which in turn will heavily influence the Federal Reserve’s upcoming decision on core interest rates. Markets remain acutely focused on the fate of the global oil trade, particularly after US President Donald Trump hinted at a possible easing of the Strait of Hormuz blockade over the weekend. In a post on Truth Social, Trump stated that "the Countries of the World that receive Oil through the Hormuz Strait must take care of that passage, and we will help — A LOT!" pledging US coordination to ensure smooth passage. This statement provided some relief, but WTI oil still opened the week above the $100 mark, with Bitcoin and US stock futures showing an initial positive correlation as TradFi traders returned.

Trading resource The Kobeissi Letter succinctly summarized the situation on X: "We now have the Iran war, inflation data, and a Fed meeting all in the same week." The inflation prints are indeed coming thick and fast, with the latest Manufacturing Purchasing Managers Index (PMI) report from the Institute of Supply Management (ISM) due on Monday. This report, which currently indicates US manufacturing is back in expansion mode, previously triggered a bullish response from Bitcoin price action in February. However, Kobeissi also warned, "If energy prices remain elevated, manufacturers may have little choice but to pass costs on to retailers and consumers," concluding that "The manufacturing recovery is alive, but the inflation threat seems to be back." Further critical data arrives on Wednesday with the Fed’s rate decision and the next release of the Producer Price Index (PPI), which provides insight into inflationary pressures at the producer level, preceding consumer price changes. These economic indicators will be closely scrutinized for their potential to either exacerbate or alleviate the current inflation rebound fears, especially as the Middle East debacle continues to unfold.

In a notable divergence, gold has begun to roll over just as Bitcoin shows signs of a rebound, raising questions about their respective roles as safe havens during uncertainty. For the past six months, gold has enjoyed successive breakouts while BTC/USD plumbed multiyear lows, contrary to some expectations that Bitcoin would shine during geopolitical turmoil. Despite the Israel-Iran conflict offering an ideal use case for gold as a traditional safe haven, the precious metal has so far offered a surprisingly muted response. Analyst Lukas Kuemmerle observed in his "Commodity Report" newsletter, "Gold has been consolidating over the past two weeks — even though the escalating Iran conflict would typically be expected to drive prices higher." He described the metal’s muted reaction as having "left many market participants puzzled." Kuemmerle further elaborated that gold’s performance during military conflicts is historically "mixed," suggesting oil might be a more suitable direct hedge. He clarified that "Gold offers less protection against the conflict itself, but rather against its monetary and financial side effects — think inflationary pressure, currency devaluation, or fiscal dislocations." This week, XAU/USD dipped below the $5,000 mark, hitting its lowest levels since mid-February, and against Bitcoin, gold dropped to levels not seen since February 5.

On a more optimistic note for Bitcoin, crypto trader Michaël van de Poppe recently flagged an "emerging bullish divergence" in relative strength index (RSI) readings for BTC/XAU (Bitcoin against Gold). The RSI is a momentum oscillator that measures the speed and change of price movements, helping to identify overbought or oversold conditions. Van de Poppe highlighted, "The weekly RSI remains to be in the oversold territory. Historically, especially in 2015, 2018 and 2022, this has provided a signal that the markets are bottoming and that there’s a reversal happening." He added that the daily chart was already providing clues, forecasting a capital rotation from gold to Bitcoin. "I would assume we’ll see a stronger breakout upwards occur in the coming week, as this is the first time it’s breaking above the 21-Day MA since the breakdown in October," he stated, referring to the pair’s 21-day simple moving average trend line.

Further bolstering the case for a broader Bitcoin market recovery, on-chain analytics platform CryptoQuant points to what it describes as "the most bullish charts in months." Contributor Amr Taha summarized in a QuickTake blog post on Monday, "3 different charts are showing activity we haven’t seen in weeks or even months." He highlighted three key indicators:

- Declining Exchange Inflows: Taha noted a "significant drop" in both retail and whale wallet flows to Binance on rolling 30-day time frames. Specifically, whale inflows plummeted from $8.8 billion to $4.5 billion in the first two weeks of March. This decline in exchange inflows is historically bullish, as "fewer coins are available on spot markets," thereby reducing selling pressure.
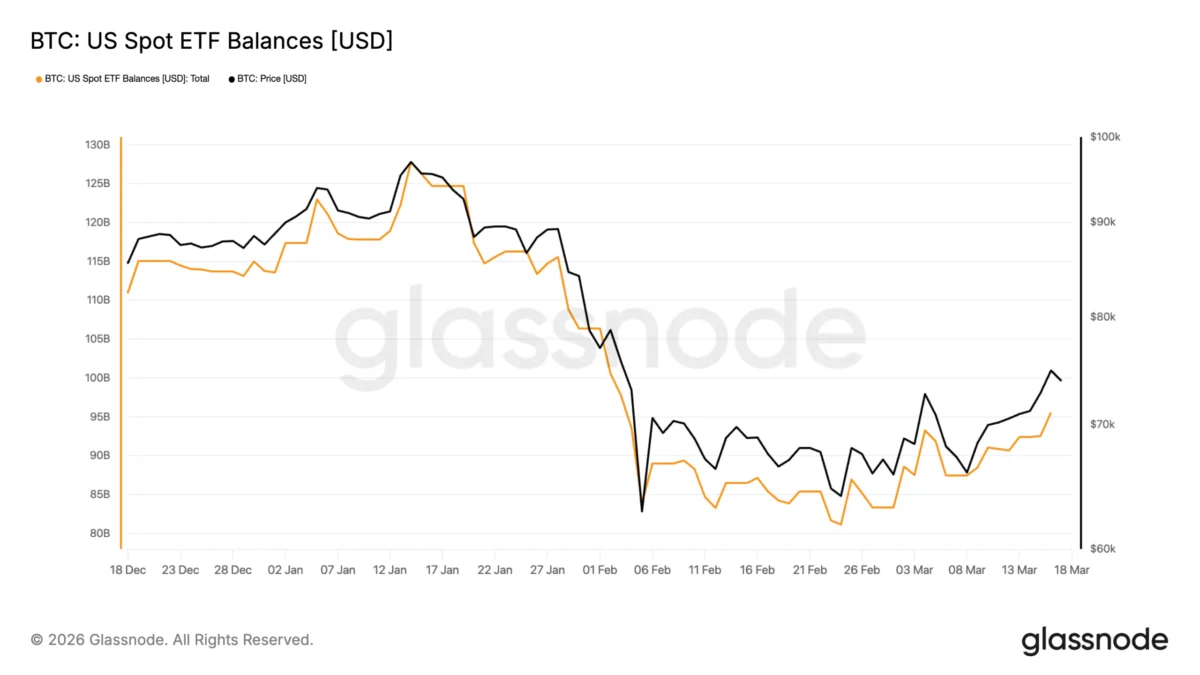
- Consistent US Spot Bitcoin ETF Net Inflows: The US spot Bitcoin exchange-traded funds (ETFs) have experienced net inflows every single trading day since March 9. CryptoQuant stated, "Positive ETF flows reflect direct BTC buying pressure, reinforcing market support from institutional investors," indicating sustained institutional demand.
- Significant Stablecoin Liquidity Expansion: On March 11, a substantial $1 billion minting of USDt (USDT), the largest stablecoin, occurred on the Tron network. This event marks the first major liquidity expansion in over a month, with the previous mint of similar size taking place on February 6. Taha explained, "The creation of new USDT can signal fresh capital entering the market, potentially increasing available liquidity for trading activity," suggesting a readiness for increased trading volume and potential upward price movement.
In essence, while Bitcoin faces intense macro headwinds from geopolitical instability, inflation concerns, and a pivotal Fed meeting, coupled with formidable technical resistance at $75,000 and lingering bearish long-term signals like the death cross, underlying on-chain data and a shifting dynamic with gold suggest a growing undercurrent of bullish sentiment and capital accumulation. The coming week promises to be a decisive period, testing Bitcoin’s resilience and its capacity to carve out a new trajectory amidst a complex and uncertain global financial landscape.