This optimistic outlook is primarily anchored in the behavior of the Relative Strength Index (RSI), a momentum oscillator widely used by technical analysts to measure the speed and change of price movements. The RSI, typically displayed on a scale from 0 to 100, helps traders identify overbought or oversold conditions in an asset. Readings above 70 generally suggest an asset is overbought and might be due for a correction, while readings below 30 indicate it’s oversold and could be ripe for a rebound. However, beyond these simple thresholds, the RSI’s trend lines and divergences from price action can offer powerful predictive insights, often acting as a "leading indicator" by signaling shifts in momentum before the price itself makes a decisive move.
A notable observation comes from trader BitBull, who highlighted an ongoing breakout on Bitcoin’s weekly RSI in a recent X post. Despite Bitcoin’s price action appearing somewhat range-bound in the immediate term, a crucial shift in the RSI trend has been unfolding since December. Specifically, a downtrend that had characterized the indicator since September of the previous year (2025) has now been decisively broken. This breakthrough occurred before the close of the previous year’s trading period, setting a potentially bullish tone for the new year. BitBull emphasized, "$BTC weekly RSI is calling for more upside here. Broke out of its 3-month downtrend and holding above the breakout line." This technical pattern is significant because it often precedes sustained price appreciation.

To illustrate the potential impact, BitBull provided an accompanying chart comparing the current breakout with a similar one observed earlier in the previous year. That prior breakout, following local lows of around $75,000 in April, led to several months of substantial BTC price gains. The historical parallel provides a compelling argument for the current projection. Based on this analysis, BitBull confidently added, "I think BTC could hit $103K-$105K in 3-4 weeks." This timeframe suggests a rapid ascent, indicating that the underlying buying pressure, as reflected by the RSI, is robust and building momentum. The weekly RSI, being a higher timeframe indicator, typically carries more weight than daily or hourly signals, implying a more sustained and powerful trend shift.
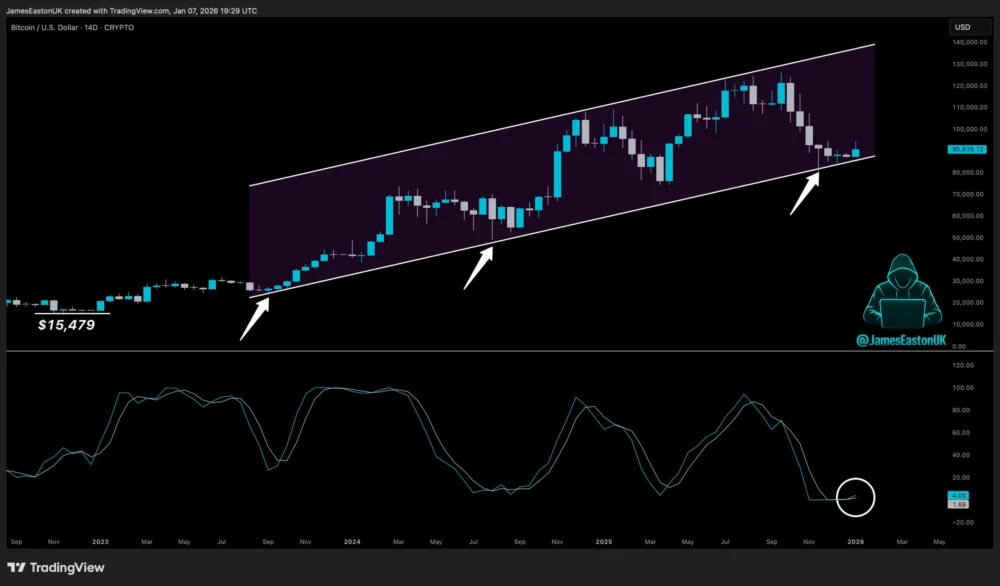
Further supporting the bullish sentiment, James Easton, host of the crypto trading podcast DeCRYPTion, shared equally encouraging news regarding the RSI on the two-week chart. Easton pointed out that the indicator is currently at levels lower than those witnessed during the nadir of Bitcoin’s last full bear market in late 2022. This is a crucial observation because it suggests that despite recent price increases, Bitcoin is far from being in an "overbought" state on this longer timeframe, leaving ample room for upward movement. More importantly, Easton noted that the two-week RSI "has also just flipped bullish," an event that historically signals a significant shift in market dynamics. His succinct advice to followers was, "Strap in," implying that a substantial rally could be imminent. This signal, coming from a two-week chart, reinforces the long-term bullish conviction, suggesting that the current market phase could be an early stage of a larger uptrend, similar to the beginnings of previous bull cycles.
Even on lower timeframes, the RSI signals appear to be aligning with the bullish narrative, according to data from TradingView. The four-hour chart, for instance, revealed a potential "hidden bullish divergence." This technical pattern occurs when the price registers higher lows, but the RSI simultaneously prints lower lows. This divergence is often interpreted as a sign of weakening sell-side pressure despite price consolidation or minor pullbacks. In the context of Bitcoin’s current market behavior, this implies that while sellers might be attempting to push the price down, their efforts are losing steam, and underlying buying interest is absorbing the supply at higher levels. This scenario is particularly relevant as Bitcoin attempts to solidify the $90,000 mark as a robust support zone, suggesting that any dips are being bought up, thus reinforcing the foundation for future price increases.

However, the path to $105,000 is not without its potential pitfalls, and not all market participants share the same degree of optimism. As Cointelegraph previously reported, some traders still anticipate lower price levels before Bitcoin can establish a durable long-term support base. These more bearish perspectives suggest that the market might need to undergo further consolidation or even a deeper correction to "shake out" weaker hands and build a stronger foundation for a sustained rally. Among the more cautious calls is the expectation for Bitcoin’s price to revisit its April lows, which were around $75,000. Additionally, a trip below the 2026 yearly open, which represents the price at which Bitcoin began the current year, is also considered a possibility by some analysts. This would imply a significant retracement from current levels, challenging the immediate bullish projections.
Trader Johnny (@CryptoGodJohn) articulated this cautious sentiment, posting, "If we cannot fill the resistance to support soon on $BTC I think a sweep of these lows comes next." This perspective suggests that if Bitcoin fails to decisively break through overhead resistance and establish new support levels quickly, it risks a downturn to retest previous significant lows. Such a retest would typically be seen as a healthy market correction, flushing out excess leverage and allowing for a more organic, sustainable ascent thereafter.
Adding another layer of complexity to the immediate market dynamics, trader Skew provided an analysis of exchange order-book behavior, flagging the presence of a "passive seller" at the $91,500 level. A passive seller places limit orders to sell at a specific price, rather than market orders that execute immediately. This creates a ceiling of resistance, suppressing upward price movements as buying pressure is absorbed by these standing sell orders. Skew noted that this particular seller was "quoting around 60 – 100 BTC each time," which, while not "that significant" in the grand scheme of Bitcoin’s daily trading volume, was enough to keep price suppressed. He concluded that this phenomenon "likely tells me the buy pressure during US session was related to a clear US buyer," indicating a tug-of-war between persistent buying demand, possibly from institutional or large individual investors in the US, and a consistent but not overwhelming selling presence at a critical resistance point. This dynamic highlights the current consolidation phase, where strong directional moves are being met with counter-forces, leading to range-bound trading until one side gains a decisive advantage.

Looking beyond the immediate technical signals, several broader market factors could either propel Bitcoin towards or hinder its journey to $105,000. The recent approval and increasing adoption of spot Bitcoin Exchange-Traded Funds (ETFs) in the US have fundamentally changed the landscape for institutional investment, providing a regulated and accessible gateway for traditional finance to enter the crypto space. Sustained inflows into these ETFs could provide significant and consistent buying pressure. Furthermore, the upcoming Bitcoin Halving event, historically a catalyst for major bull runs, continues to loom as a powerful supply shock, reducing the rate at which new Bitcoin enters circulation and potentially driving up its value if demand remains constant or increases.
Macroeconomic conditions also play a pivotal role. Factors such as global inflation rates, central bank monetary policies (e.g., interest rate decisions), and the overall strength of the global economy can influence investor appetite for risk assets like Bitcoin. A dovish shift in central bank policies or continued concerns about fiat currency debasement could drive more capital into Bitcoin as a perceived store of value or inflation hedge. Conversely, a tightening of monetary policy or a significant economic downturn could exert downward pressure. Geopolitical stability or instability can also impact market sentiment, with Bitcoin sometimes acting as a safe haven asset during times of global uncertainty.
Historically, Bitcoin’s price movements have been characterized by cycles of rapid growth, followed by corrections and consolidation. The current market phase, characterized by strong technical signals on higher timeframes and significant institutional interest, suggests that the groundwork for a potential bull run to new all-time highs is being laid. The $105,000 target, while ambitious in the short term, is well within the realm of possibility if the bullish RSI breakouts translate into sustained buying volume and market sentiment remains positive. However, market participants must remain vigilant, as the cryptocurrency market is notoriously volatile and subject to rapid shifts based on news, sentiment, and unexpected events.

This article does not contain investment advice or recommendations. Every investment and trading move involves risk, and readers should conduct their own research when making a decision. While we strive to provide accurate and timely information, Cointelegraph does not guarantee the accuracy, completeness, or reliability of any information in this article. This article may contain forward-looking statements that are subject to risks and uncertainties. Cointelegraph will not be liable for any loss or damage arising from your reliance on this information.