This revelation comes as a beacon of hope for long-term investors, suggesting that Bitcoin (BTC) may be nearing the culmination of its current corrective phase, as a classic on-chain price metric breaches historical records. Crypto trader, analyst, and entrepreneur Michaël van de Poppe highlighted this critical development in a recent post, drawing attention to the lowest-ever readings for Bitcoin’s MVRV Z-score. Describing the accompanying chart as "phenomenal," Van de Poppe underscored the gravity of the data, which was sourced and affirmed by crypto analyst James Easton, who similarly noted the "wild" and historically low levels the chart now exhibits.
To fully grasp the significance of these findings, it’s essential to understand the mechanics of the MVRV Z-score. MVRV stands for Market Value versus Realized Value. This metric is a powerful tool in on-chain analysis, designed to assess when Bitcoin is overvalued or undervalued relative to its "fair value." It achieves this by comparing two fundamental components:
- Market Value (Market Cap): This is the current price of Bitcoin multiplied by the total circulating supply. It represents the aggregate value of all Bitcoin in existence at any given moment.
- Realized Value (Realized Cap): This is a more nuanced metric. Instead of using the current market price, it calculates the value of all Bitcoin based on the price at which each coin last moved on-chain. Essentially, it approximates the average cost basis of all Bitcoin held by investors. It effectively filters out short-term price fluctuations and offers a more stable representation of the network’s underlying value, often seen as the "true" or "realized" value held by the market participants.
The MVRV ratio, therefore, is simply Market Value divided by Realized Value. When Market Value is significantly higher than Realized Value, it suggests that many investors are holding coins at a substantial profit, potentially indicating market euphoria and an overheated market. Conversely, when Market Value approaches or falls below Realized Value, it implies that a large portion of the market is holding coins at a loss, often associated with capitulation and deep undervaluation.
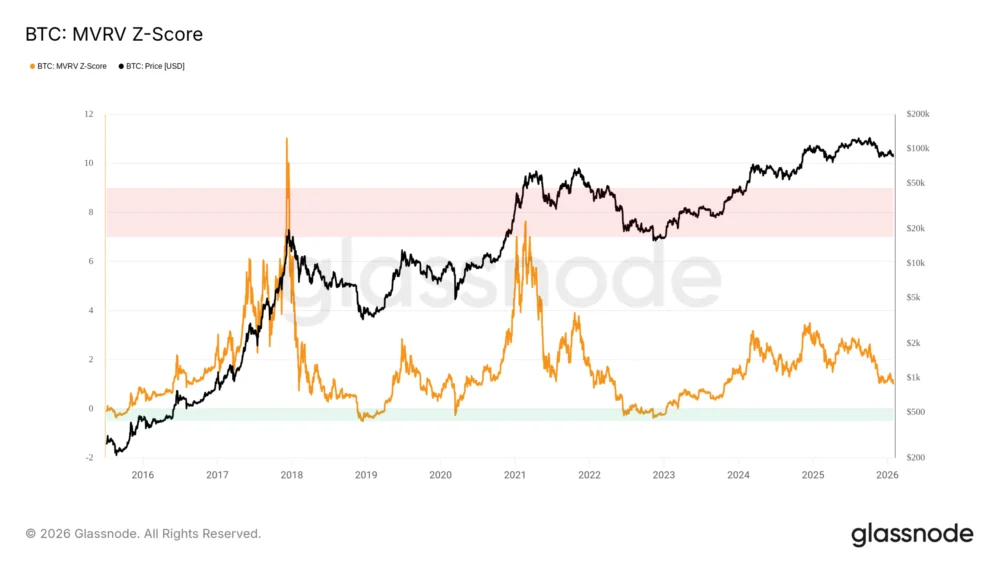
The "Z-score" component then takes this ratio and normalizes it by dividing it by the standard deviation of the market cap. This statistical technique helps to identify how far the current MVRV ratio deviates from its historical average, making it easier to pinpoint statistically significant periods of "overvaluation" (when the Z-score enters a high, often red, zone) and "undervaluation" (when it dips into a low, often green, zone). Historically, these zones have proven to be remarkably accurate indicators of major market tops and bottoms.

What makes the current situation particularly noteworthy is the depth of the MVRV Z-score’s descent. Van de Poppe explicitly stated, "The current Z-Score of $BTC is lower than during the bear market bottom in 2015, 2018, COVID crash 2020 and 2022." This is a profound statement. It implies that from a historical on-chain perspective, the current market presents a buying opportunity that is statistically more compelling than even the most infamous periods of Bitcoin’s past capitulation.
Let’s briefly recall those previous troughs:
- 2015 Bear Market: Following the Mt. Gox scandal and the initial euphoria of Bitcoin’s first major bull run, BTC endured a brutal bear market, falling from over $1,000 to below $200. The MVRV Z-score dipped deep into its green "undervalued" zone, marking a generational buying opportunity.
- 2018 Bear Market: After reaching nearly $20,000 in late 2017, Bitcoin crashed throughout 2018, bottoming out around $3,200. Again, the MVRV Z-score accurately signaled this bottom, moving into its lowest percentile.
- COVID Crash 2020: The global economic uncertainty triggered by the COVID-19 pandemic led to a sudden, dramatic flash crash across all financial markets, including Bitcoin, which briefly fell below $4,000. This swift capitulation was also captured by a temporary but significant dip in the MVRV Z-score.
- 2022 Bear Market: Fuelled by macroeconomic tightening, the collapse of major crypto entities like Luna/Terra, Three Arrows Capital, and FTX, Bitcoin experienced a prolonged bear market, eventually bottoming near $15,500. The MVRV Z-score again provided a clear "undervalued" signal at this crucial juncture.
The fact that the current Z-score has fallen even lower than these historically significant bottoms suggests an extreme level of market fear and capitulation. It indicates that the average cost basis of Bitcoin holders is now closer to, or even above, the current market price than during previous periods of extreme undervaluation. This often precedes a significant market reversal, as the pool of potential sellers willing to take losses dwindles, and the asset becomes attractive to long-term value investors.
"That’s how deep we’re in the bear market, and yes, we’re close to the end of it," Van de Poppe concluded, reinforcing the optimistic outlook for a market turnaround. Raw data from on-chain analytics platform Glassnode further confirms this, showing the Z-score at its lowest levels since October 2023. At that time, BTC/USD was trading around $30,000, illustrating how much more "undervalued" the asset has become even since its previous recent low. The last time the "live" Z-score dipped into its green "undervalued" zone for a sustained period was at the end of the last bear market in 2022, which ultimately set the stage for Bitcoin’s resurgence.
This profound undervaluation is occurring against a backdrop of recent challenging price action for Bitcoin. The asset fell to new two-month lows this week, with BTC/USD hitting approximately $81,040, according to data from TradingView. At the time of writing, Bitcoin was still struggling to regain lost ground, down nearly 2% versus the daily open. This decline was not isolated; it was part of a broader sell-off across risk assets and even precious metals, indicating a widespread "risk-off" sentiment in global markets. Factors such as evolving macroeconomic conditions, interest rate speculations, and geopolitical uncertainties often contribute to such synchronized market movements, pushing investors away from perceived riskier assets.

Cointelegraph previously reported on a prediction that the period around the January monthly close would see Bitcoin establish a long-term floor, mirroring the patterns observed at the conclusion of prior bear markets. Reacting to the broader market dynamics, Van de Poppe also weighed in on the performance of traditional safe-haven assets. He noted that both gold and silver appeared "done for now," having experienced significant drops of 10-15% in a short span. While this might seem bearish, Van de Poppe offered a nuanced perspective: "I’m not saying: the bull is over. No, far from it. But it will consolidate, and that’s also the trigger you’d like to see for Bitcoin." This suggests that a period of consolidation in traditional markets, particularly precious metals, could free up capital or shift investor focus back towards higher-growth assets like Bitcoin, serving as a catalyst for its recovery.
The MVRV Z-score’s current reading provides a compelling narrative for long-term investors. It implies that the pain of the current correction has driven the asset into a territory where, historically, smart money has accumulated. The Realized Cap, often considered a proxy for the aggregate cost basis of the market, effectively tracks the "true" value held by investors. When the Market Cap falls significantly below this Realized Cap, it means a substantial portion of the market is holding Bitcoin at a loss. This condition is unsustainable in the long run, as it typically leads to a capitulation event followed by a period of accumulation by strong hands, ultimately paving the way for a new uptrend.
While the MVRV Z-score is an incredibly potent on-chain indicator, it’s crucial to remember that no single metric provides a complete picture. Other factors, such as global macroeconomic trends, regulatory developments, technological advancements within the Bitcoin ecosystem, and continued institutional adoption, will also play a role in its future price trajectory. However, the current MVRV Z-score readings offer a robust, data-driven argument that Bitcoin is experiencing an extreme level of undervaluation, even more pronounced than during previous market bottoms. This positions the current period as a potentially historic opportunity for investors with a long-term horizon, suggesting that while the immediate market sentiment remains challenging, the underlying on-chain data points towards the imminent end of the correction and the potential for a significant rebound. The market may be fearful, but the data suggests that now might be the time for conviction.
This article does not contain investment advice or recommendations. Every investment and trading move involves risk, and readers should conduct their own research when making a decision. While we strive to provide accurate and timely information, Cointelegraph does not guarantee the accuracy, completeness, or reliability of any information in this article. This article may contain forward-looking statements that are subject to risks and uncertainties. Cointelegraph will not be liable for any loss or damage arising from your reliance on this information.